Monthly Archives: August 2010

BUY BONDS? NO THANKS

We’ve had quite the debate lately as to whether bonds are in a bubble or not. I actually think they were in a bubble, but the bubble has already popped.

First off know that bond cycles tend to be very long and reverse very slowly. So we aren’t going to see bonds just collapse like a stock market crash and all of a sudden we have interest rates pushing 15%. That just doesn’t happen in the bond market.

Know also that 25 to 30 years is about as long as a bond cycle ever lasts.

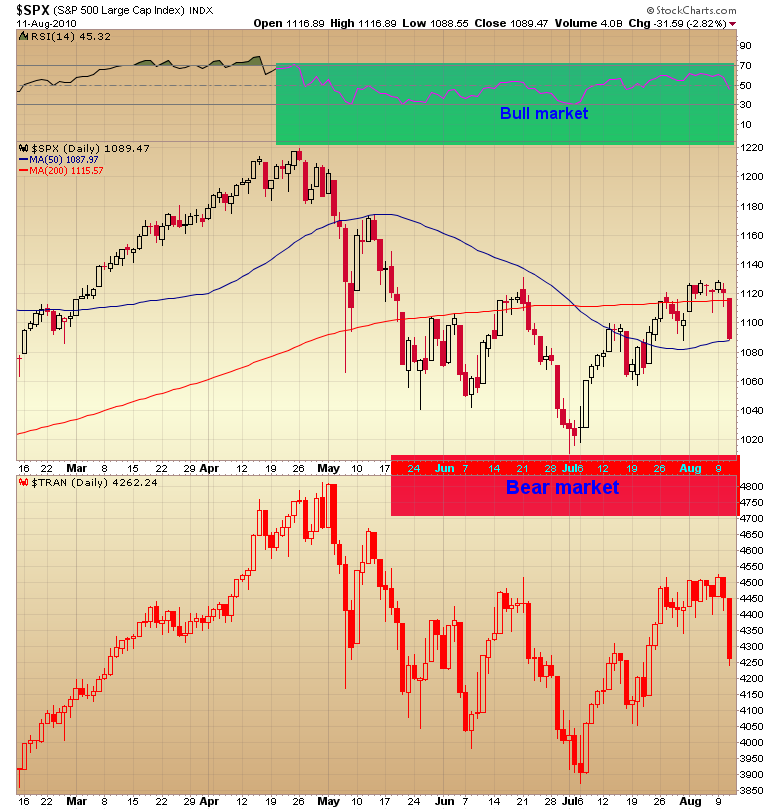
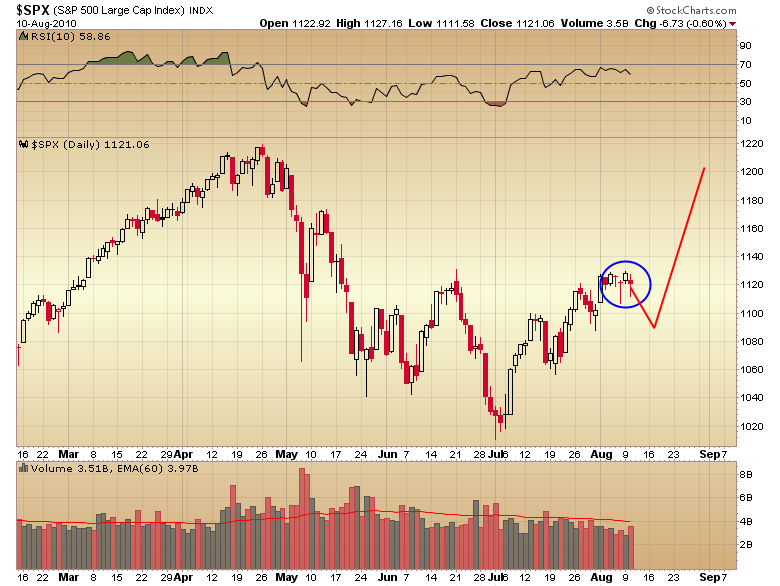
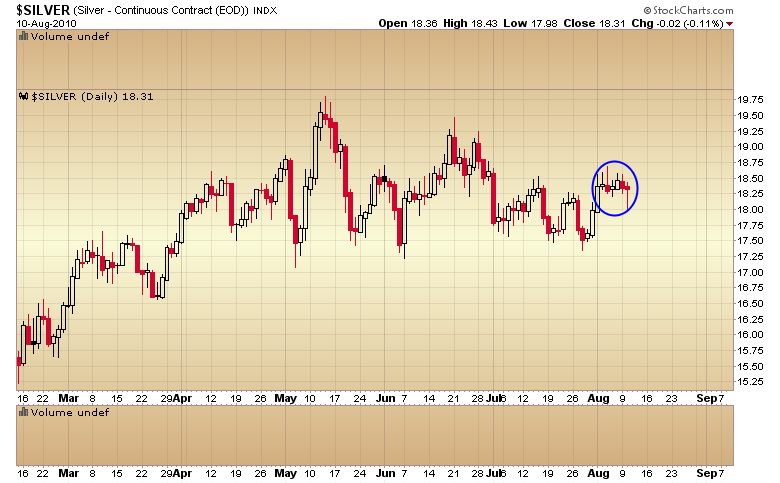
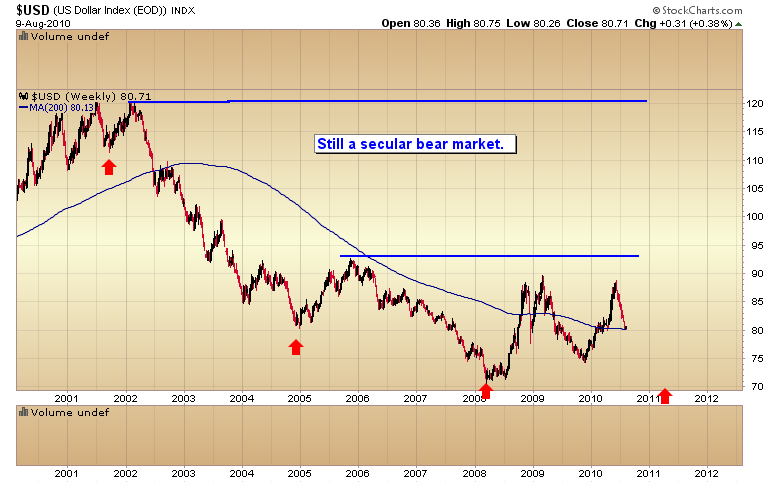
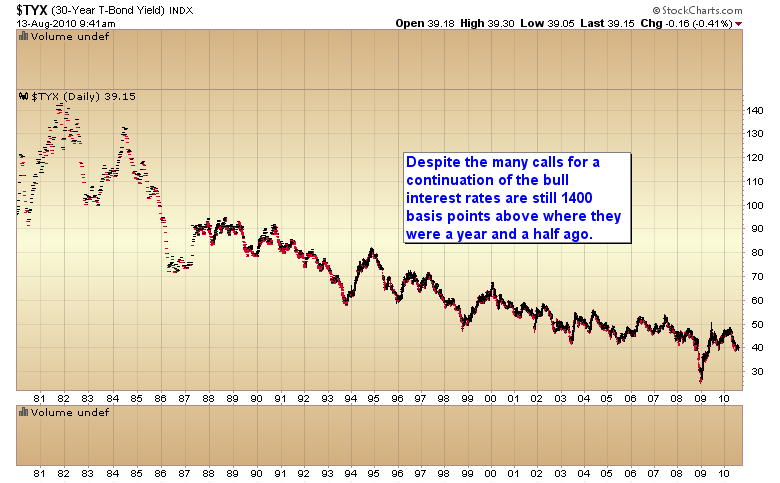
Now take a look at the following charts.

That is a 29 year bull market, complete with a final parabolic move out of the trading range on the Fed’s ill fated attempt to artificially control long term rates.
I have news for you, when ever the government tells you it is going to force the market to do something you can pretty much get on the other side of that trade with virtual impunity. (Remember what happened when the SEC banned short selling in financials) Markets are just too big for anyone to change a secular trend. Any attempt to do so will just hasten what would have happened anyway.
As you can see Bernanke did just that. The Fed’s attempt to control long term rates just accelerated the final move resulting in the bond market immediately reversing and now even after a year and a half interest rates are still 140 basis points above the “Bernanke bottom”.

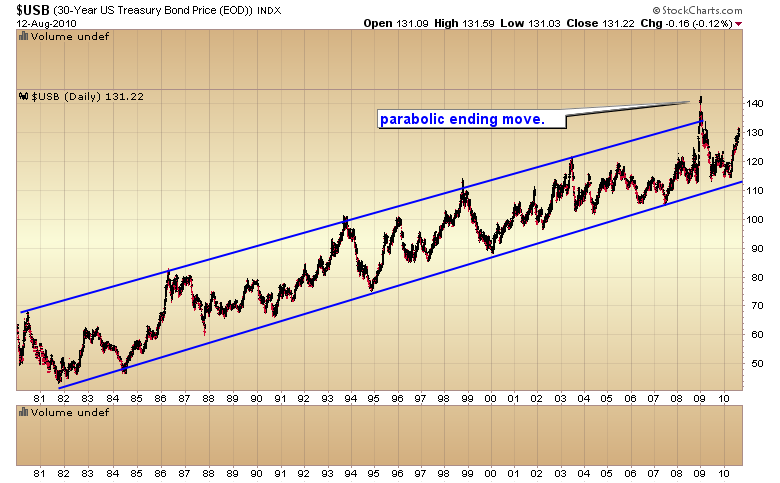
I believe the recent rally over the last few months is the initial echo rally (a bear market rally) that will top and roll over before making new highs.

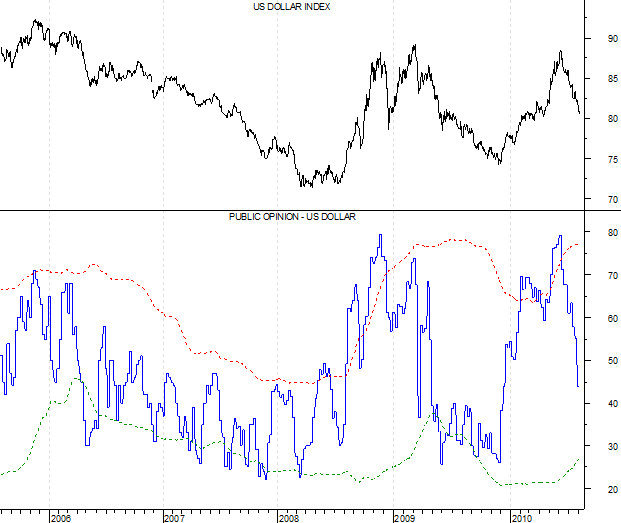
Ask yourself, would you lend money at 4% for 30 years to a country that is actively trying to debase it’s currency and is so deeply in debt that we will never be able to pay that debt off without even further currency debasement? Don’t forget you would be buying into a market that has been in a steady uptrend for 30 years.

Of course you wouldn’t.

I know there are plenty of analysts that will argue for the continuation of a 30 year bull, but then those same people expected the tech bubble to continue for eternity and these are the same analysts who had convinced themselves that there was a shortage of real estate in `05 & `06. At secular bull market tops the masses will always be able to manufacture nonsense reasons for why the bull will continue indefinitely. At secular bull market tops common sense gets thrown out the window.

Human nature never changes. I can also guarantee that the top of the gold bull will be no different. If you think bond bulls, real estate bulls or tech bulls were ridiculous I can assure you they won’t hold a candle to the absolute insanity that will reign among gold bugs when the secular gold bull tops.

After taking a quick look at the long term bond chart it appears bonds have a major cycle low about every 2-2 1/2 years. They just did put in that cycle low this year.

You can see from this chart that every 2 year cycle has bottomed above the last. If this was to change it would break the pattern of higher highs and higher lows.

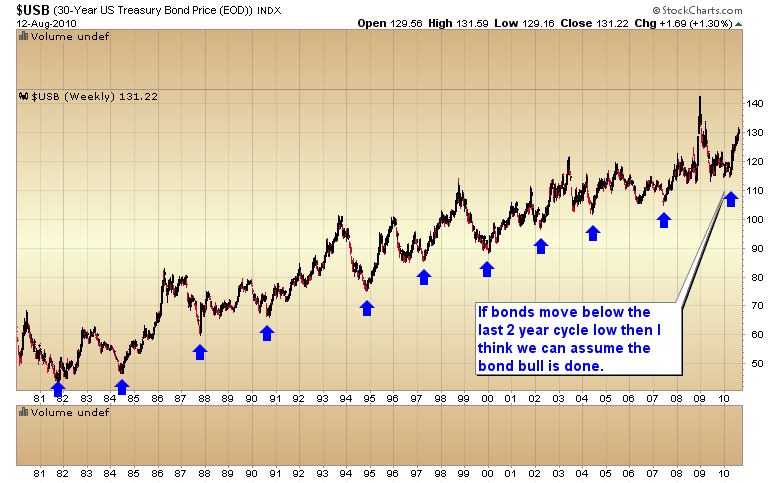
So we have a simple cyclical sign to watch for. If bonds are unable to move to new highs during this cycle and if they move below the spring low then we will have confirmation that the secular bull market in bonds has expired.

BULL OR BEAR

I’m getting flooded with emails wanting to know if I think the bear is back. Let me repeat again my three requirements.

1. Stocks have to move below a yearly cycle low. They did that in July. So this one is a check mark for the bears.

2. The 50 DMA must cross below the 200 DMA and the 200 has to turn down. We have half of that condition met. The 50 has crossed below the 200. Half a check mark for the bears.

3. We must get a Dow Theory sell signal. In order for that to happen both the industrials and transports must close below the July low. That clearly hasn’t happened yet.

Until that happens we are stuck with only half the conditions and the market remains in no-mans land between those two lines in the sand.
If the red line gets crossed by both the Dow and the trannies I will have no problem calling the bear. But until it does there is simply no need to second guess what the market is going to do before it happens.
The mathematics of the short side don’t require one to catch the top of rallies in order to make money.
Just as an example selling short at the recent top (1120) and covering at 600 (I’m assuming a bear market) would garner one 46%.
However a more cautious trader could wait for the signal that the bear has returned and sell short at 1000, cover at 600 and still make 40%. Is 6% really worth the gamble that you might be early to the trade? No of course it’s not. A sophisticated trader understands this and waits for proper confirmation before he goes all in on a bear market.
I think we are probably headed into the daily cycle low. If the coil plays out true to the stats then we will get that bottom in the next 1-4 days.
If however the dollar has put in an intermediate cycle bottom then we would probably not see a final bottom for 2 to 3 weeks (the daily cycle usually runs between 28-40 days give or take a few in either direction).
Since today was the 28th day stocks are actually now in the timing band for that low. It just remains to be seen whether the cycle will bottom early in the cycle as the coil suggests or later in the cycle as is typical of most cycles.

COILS IN S&P AND SILVER

We now have a volatility coil forming on the S&P and silver. Contrary to what one might think the initial move out of a coil, although it is often aggressive, usually ends up being a false move soon to be followed by a more powerful and durable move in the opposite direction.

Yesterday was the 27th day of the daily cycle in stocks so it is possible that stocks are dropping into a slightly early daily cycle low.

The dollar is bouncing which may signal a slightly early daily cycle bottom there also. However that opens up the possibility that the dollar could have another entire daily cycle before the larger intermediate cycle bottoms.

The total lack of any selling on strength days during this rally suggests that a breakdown out of the coil will be reversed soon as the odds suggest. In the last 5 years only one intermediate rally has topped without at least one of these large negative money flow days. With no sign of smart money selling yet it is unlikely the intermediate rally is finished.

And sentiment still hasn’t reached bullish extremes either. Intermediate rallies don’t usually end until sentiment reaches extremes and that includes bear market rallies.

STILL A BEAR

Contrary to what some would have us believe the dollar is still in a secular bear market. Yes I will be the first one to admit that it is currently in a cyclical bull phase (I said so when the 50 crossed above the 200 and the 200 turned up) …the same applies to the stock market by the way.

But there is nothing on any chart that suggests this is anything other than a really big bear market rally. The pattern of lower lows and lower highs is still intact.

I’ve marked the 3 year cycle lows with red arrows and drawn in a line at 3 year cycle tops. So far each red arrow is lower than the last and each top has failed to move above the previous one.

In order for the dollar to end it’s bear market it will have to break that pattern.  We do have a window of opportunity in the next year. If the dollar can hold above the April `08 low at the next 3 year cycle bottom then we will have half the pattern broken. It would then have to rally above 90 in order to completely reverse the secular bear trend.

However the current 3 year cycle is again extremely left translated (topped in less than 18 months). Most of the time left translated cycles move below the prior cycle low. You can see the previous two cycles were also left translated and both dropped below the previous 3 year cycle low.

Cyclically speaking the dollar is now in a weak position and the odds are greater than 50% that we will see the dollar drop below 71 sometime next year.

Also contrary to what some would have us believe sentiment on the dollar is hardly bearish. The 6 month rally has done it’s job and skewed sentiment back to the extreme bullish side of the boat. At the recent top sentiment was as bullish as it was during the brief deflationary period in `08/`09.

Chart courtesy of www.sentimentrader.com
As you can see in the above chart even the virtual collapse over the last two months hasn’t pushed sentiment anywhere close to the levels that are needed to put in a major bottom. I suspect that won’t occur until we drop into the 3 year cycle low and generate some real fear that the dollar is toast.
As a reminder we saw exactly that kind of sentiment on the Euro recently. At the time virtually everyone had become convinced the EU was going to unravel and the Euro was going to fade into history. We need to see that kind of sentiment in the dollar before we can put in the 3 year cycle low. As you can see we aren’t even close yet.

So for the time being it’s still a secular bear market.

SOMETHING BIG IS BREWING

Now that we have a weekly swing low and a higher high I think the odds are heavily in favor of the intermediate cycle bottom being in place for gold. Just like all the calls for a market crash back in June, the calls for sub $1000 gold are probably going to be a bit premature. I really doubt we will ever see $1000 gold again during this bull market.

It was simply getting too late in the intermediate cycle for gold to have enough time to make it all the way back to $1000. Just like we had run out of time in June for the head & shoulders pattern in the stock market to have any realistic chance of completing.

This is one of the big drawbacks to relying solely on technical analysis. At bottoms the technicals will always look terrible. If one basis their trades solely on technicals they will forever be selling at bottoms and eventually they will destroy their portfolio.

History has show time and time again that trading based solely off lines on a chart just doesn’t give one an edge in the market. I would say the many technicians over the last month have just added even more data to support that conclusion.

Now don’t get me wrong, I’m not saying I don’t use technical analysis, I do. I just don’t use it exclusive of everything else. When cycles, sentiment and money flows are calling for a trend change then I ignore the charts and prepare to change directions. This is exactly how I spotted the stock market bottom and what I think will turn out to be the bottom of the gold correction.

Now I want to take a closer look at that correction, because despite the dire warnings of the gold bears, something pretty amazing happened during this correction.

Over a 6 week period gold pulled back a very modest 8.6%. That was considerably less than the 17% correction the stock market suffered and in fact one of the mildest intermediate declines of the entire secular bull market.

Even more amazing was the correction by mining stocks. I know a great many investors and traders became disgusted with miners and probably gave up on them during the last 6 weeks. But the reality is the 14% correction in miners is again one of the mildest intermediate pullbacks of the entire bull market.

I originally thought the HUI might hold above 450 for the remainder of the bull market. Admittedly I missed on that one. It dropped 20 points lower than that and spent a total of 12 days during this correction below 450. All in all though I wasn’t too far off 🙂

What I really want to call attention to is the silver market. I think something big is brewing under the surface in  silver.

Invariably silver follows gold and it usually magnifies any move, especially on the down side. So if gold drops 1% silver can be expected to shed 2-3%. At intermediate cycle bottoms silver will almost always fall apart. Often it will slice right through key technical levels. Without fail at intermediate cycle lows silver will look broken.

During the current intermediate bottom however silver did something that up to this point was just unheard of. As gold dropped into the intermediate low silver diverged positively from gold.

As gold was breaking down out of the bear flag on its way to $1155 silver did something its never done before. It ignored gold. As a matter of fact silver just continued to consolidate in the $17.50 to $18.50 range that it has been in for the last 4 months.
Folks something is going on in the silver market. Perhaps we have a supply problem brewing, who knows. What I do know is silver is now acting differently than it ever has before and I want to own a big chunk of silver and silver miners as we head into the final stages of this C-wave.

WEEKEND REPORT

I’m going to make the weekend report available to everyone this week along with a discounted yearly subscription offer. I’ve decided to just unlock the weekend report on the premium site. (I’m getting too many requests to keep up with them all).

The link to Paypal for the discounted yearly subscription is in the report.

A few people have had trouble with the charts loading in the email and this will take care of that problem too.

www.smartmoneytrackerpremium.net