Strictly Necessary Cookie should be enabled at all times so that we can save your preferences for cookie settings.
If you disable this cookie, we will not be able to save your preferences. This means that every time you visit this website you will need to enable or disable cookies again.
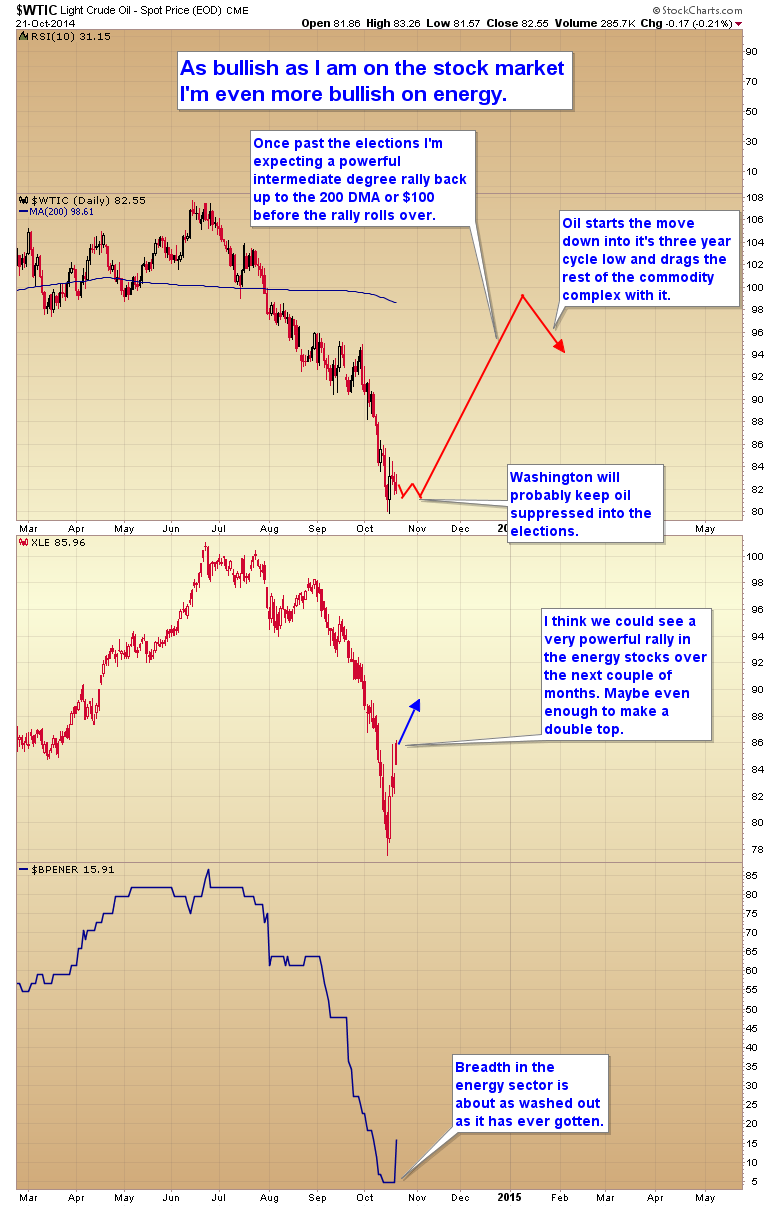
As I look at a multi-year weekly chart of crude oil, I see a 3-year cycle but it is bottoming right about NOW. I don’t know what you’re calling the “tops” and “troughs” of this 3-year cycle, but I see a solid bottom in late 2008-early 2009, then a bottom a little early in October of 2011, and another 3-years from that bottom brings us to October 2014 and if oil isn’t putting in a major cycle bottom right here, right now, it’s doing an awfully-good impersonation of one. What am I missing here? Seriously. Thanks.
The last 3 year cycle low in the CRB occurred in the summer of 2012. The next one is due in the summer or fall of 2015.