Strictly Necessary Cookie should be enabled at all times so that we can save your preferences for cookie settings.
If you disable this cookie, we will not be able to save your preferences. This means that every time you visit this website you will need to enable or disable cookies again.
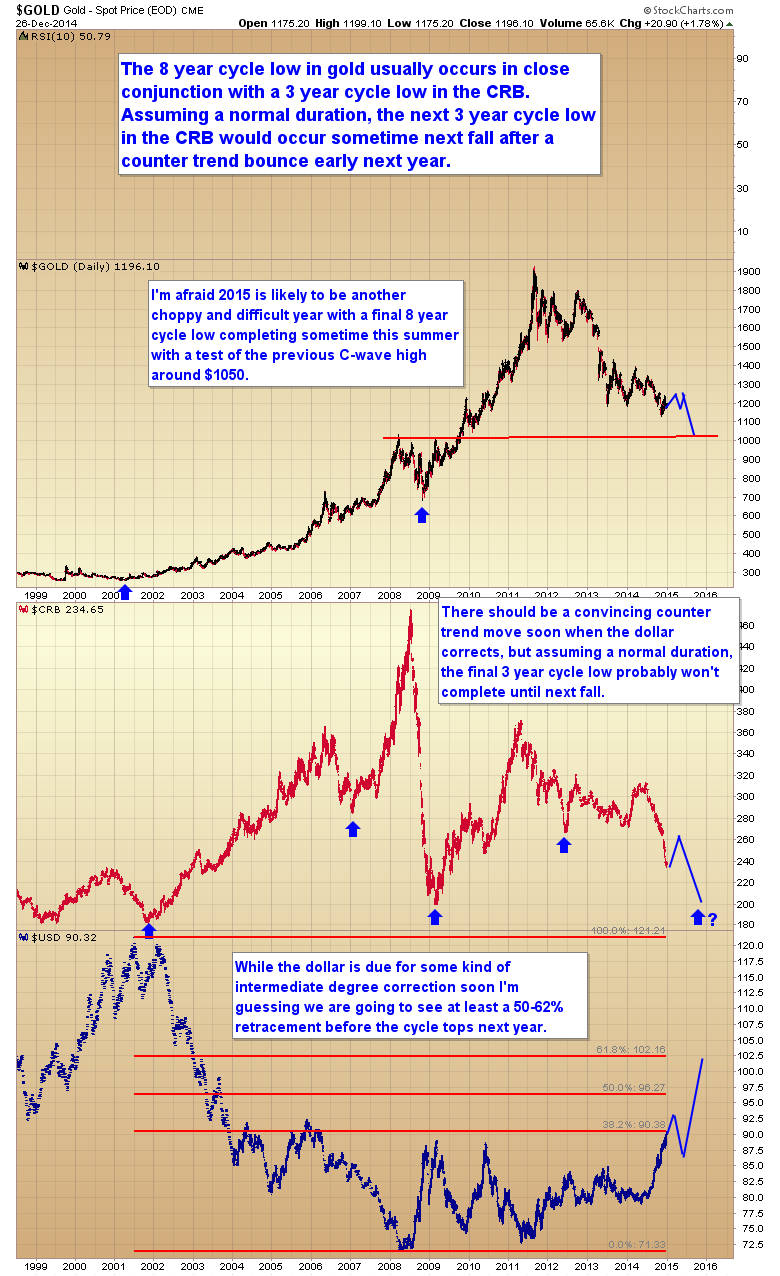
Wait you were calling for a final reversal of the the Euro near the 200 month moving average. 102 on the index the Euro would be below 110.
You moved the three-year cycle low from spring to fall is that correct?
Spring would be a little early. If we assume a normal duration then fall is a better timing target. We’ll just have to play it by ear and see how strong the move is this spring. If it’s kind of weak then it’s probably a counter trend bounce to be followed by a final move down into the 3 YCL next fall.
In my last post I noted that both the dollar and euro were trying to break through their 200 month moving averages and if they do then the next technical level that might turn the intermediate cycle back down would be a 50% retracement at about 95.
A potential trigger might be the ECB meeting on Jan. 22. No other technical, sentiment or event trigger has succeeded in turning the trends back down, which would seem to indicate an exceptionally powerful move.
Looking at Gold’s historical chart one has to peg her CURRENT wave as a “super cycle” 3 DOWN which in Elliot term’s the “most devasting” hence which ironically I TOTALLY agree with Gary as being labeled @ 1052.50ish THEN clearly a counter trend rally (wave 4 UP) then consequently THE bottom in 5 BELOW 1052.50.
Now this makes TOTAL sense as far as OTHER market variables one being the US Indices which in all likely hood will keep on chugging UP WITH the US Dollar which is NOW in a “technical breakout”.
FWIW…….
I think most EW technicians are labeling the current move a wave 5 that’s still in progress. I’m not a big fan of EW though as it usually requires a pretty good imagination to find the “counts” one wants. Just as an example the current count requires that one “ignore” two waves in 2011 and then label the wave up in 2012 as wave 2.
Of course this is nonsense as both waves in 2011 were the same size. In real time one couldn’t simply ignore those waves like you can in hindsight to make the counts “fit”.
I was able to use EW theory during the June time frame — when you have wave 1 up, then you see the wave 2 correction, wave 3 up is usually 1.6 times the size of wave 1 — and made real money. EW Theory works best on commodity markets. Of course, manipulated markets violate the assumptions of EW Theory, so … don’t expect it to work well for counting markets we know to be manipulated.
That said, the move on the weeklies, June 2013 to July 2014 looks like a textbook Elliot Wave 4 ABCDE triangle. From 1346 in July to 1130 looks like a completed wave down.
Could that be the bottom? Maybe. It seems too small, relative to the first big wave down of about $400 from the top. In EW theory, wave 5 moves in commodities can be as big as wave 3. And wave 3 was $600. This is only $216, so I’m thinking this was just subwave 1 of 5.
The move from 1130 to 1239 is a 50%-ish wave 2 retrace. The next wave should be a wave 3 down to 900-ish. According to the textbook, anyway (there are always exceptions, and crazy things like ending diagonals, etc.).
It seems implausible to me that gold could go that low. It would require a massive liquidation event, like a large central bank forced to sell gold to prop up their currency to avoid a default. A few months ago, I wouldn’t have believed it possible.
Li you are SO on it……. CURRENT wave 3 NOW should end near 1050ish.
IF you were to look at Gold’s run she still has ALOT of room DOWN for HER bottom IMHO. Silver on the other hand has been OVERSOLD for some time now however she should be in “sync” with metals in general.
Charts AND trends DON’T lie.
With Greece elections due on the 25th I can’t see the Euro strengthening against the USD – if anything, the opposite will happen as EU leaders panic and bluster. There will be much blustering from EU politicians in the coming weeks.
Bob, I’d be shocked if money flow in the energy sector as well as the metals doesn’t exceed most other sectors during the month of January. Should be a good month to be long that sector.
The Dow Junk Industrials seem to be having a big problem holding onto any momentum from the Santa Claus rally.
She like the other Indices are just in the process of “filing” her gap THEN up they all go.
The Tech bubble burst in March 2000 – is this where we are now? 8 weeks or so of boom before bust?
Is it worth the risk?
Happy 2015 GARY and may this be a most prosperous year yet!
Pingback: Slow January? - Smart Money Tracker