Strictly Necessary Cookie should be enabled at all times so that we can save your preferences for cookie settings.
If you disable this cookie, we will not be able to save your preferences. This means that every time you visit this website you will need to enable or disable cookies again.
Unless rescued by the PPT stocks will fall into a yearly cycle low over the next 3 weeks. That has the potential to be pretty scary when we get into the final bloodbath phase. But I’ll say again that this isn’t the end of the bull market. Once the YCL has completed the NASDAQ is going to rally at least up to 5100 before a final top can form.
If the Fed were to respond to the YCL with another round of QE that could be the trigger for the final parabolic blow off top.
and your target for the s@p gary?
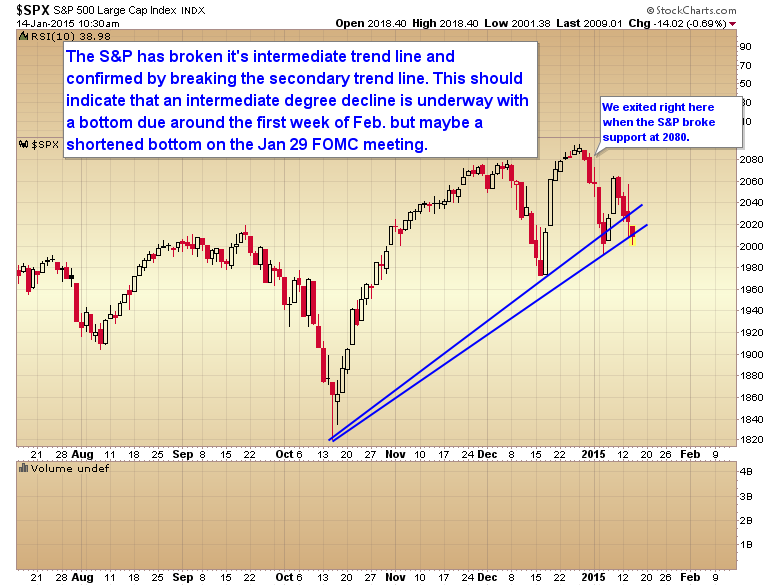
No idea. The timing band for the next bottom is probably the first week in Feb. It will probably be very choppy and hard to trade though.
Gary first off THANKS for the “head’s up” in your previous topic so I got out at the open today with my gold miners and placed a limit in DUST which nailed the open.
Also sold my long in equities at the open because I didn’t like the charts and besides the Elliot team has been calling for a fall since last week as well in which ironically coincides with today’s topic.
STILL short oil with ETF inverse since early December…….. $41.07 target??? Had other forecast fluctuation points hit via $44.86 and $49.09 since.
BTW your long call in equities a couple of weeks back was wrong right in hindsight? But then again markets change daily so been there done that still doing that with life lessons on Wall Street.
Nonetheless your batting average OVERALL IMHO if not THE best is up there with the “best of them”.
FTR: 25% oill inverse, 17% gold miner inverse and 58% cash as I type.
Notice on the chart where we exited stocks and why. Caught almost the exact top of the move.
For appreciation and commitment I will become a member and subscribe later on tonight for sure with a transaction…….Thanks Gary.
Might be time for another bounce tomorrow.
bounce in Oil or stock?
Futures so far don’t agree with that statement.