Monthly Archives: March 2015
CHART OF THE DAY
CHART OF THE DAY
CHART OF THE DAY
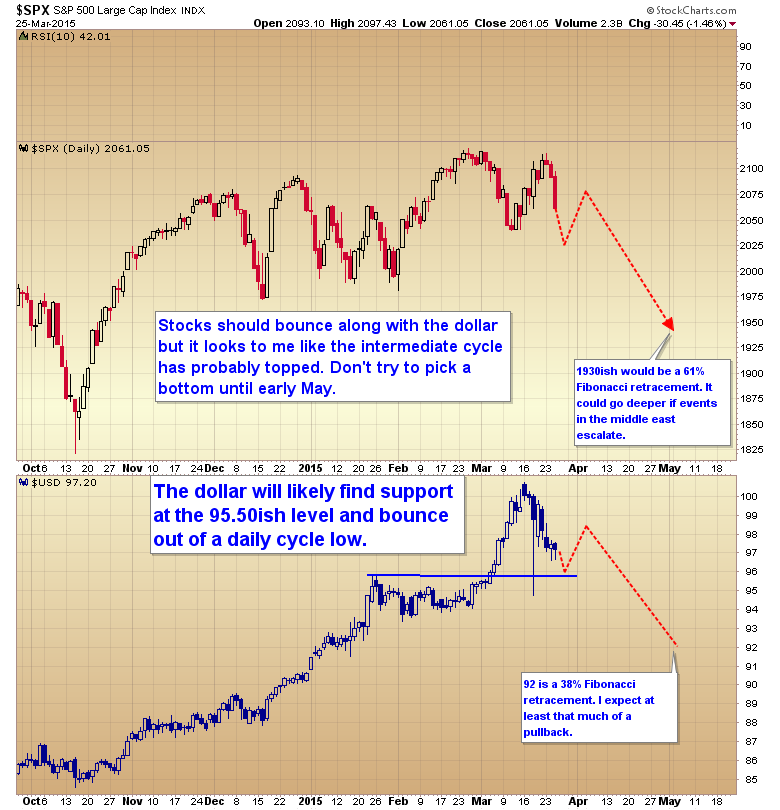
CHART OF THE DAY
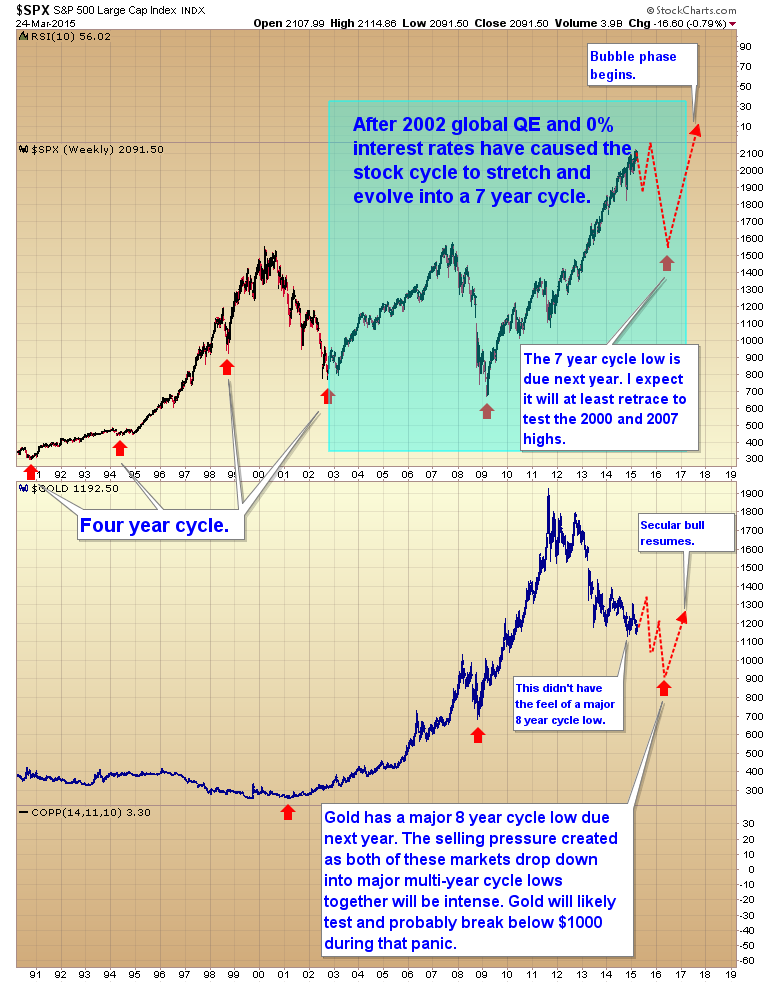
CHART OF THE DAY
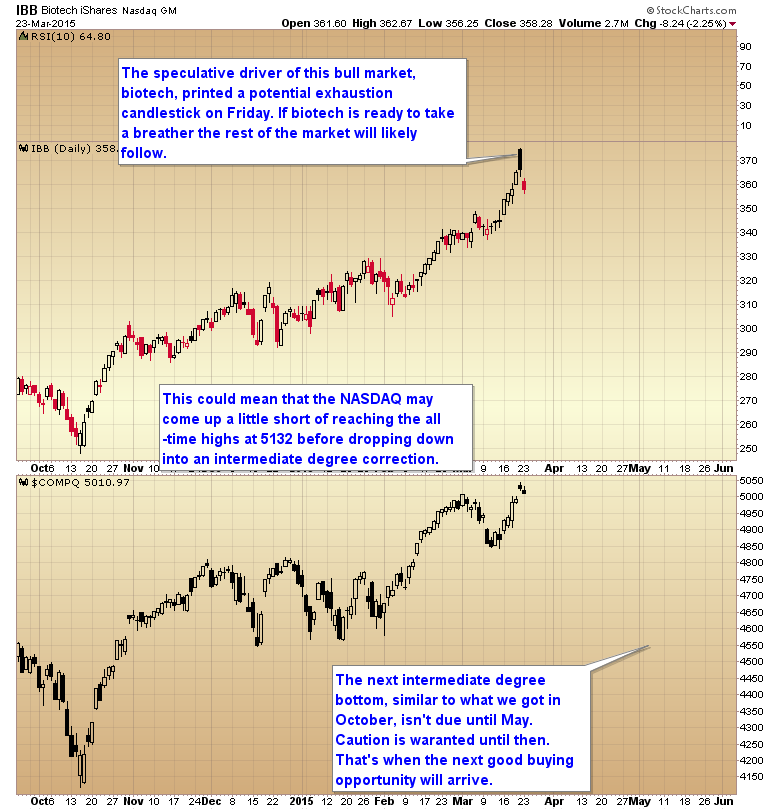
CHART OF THE DAY
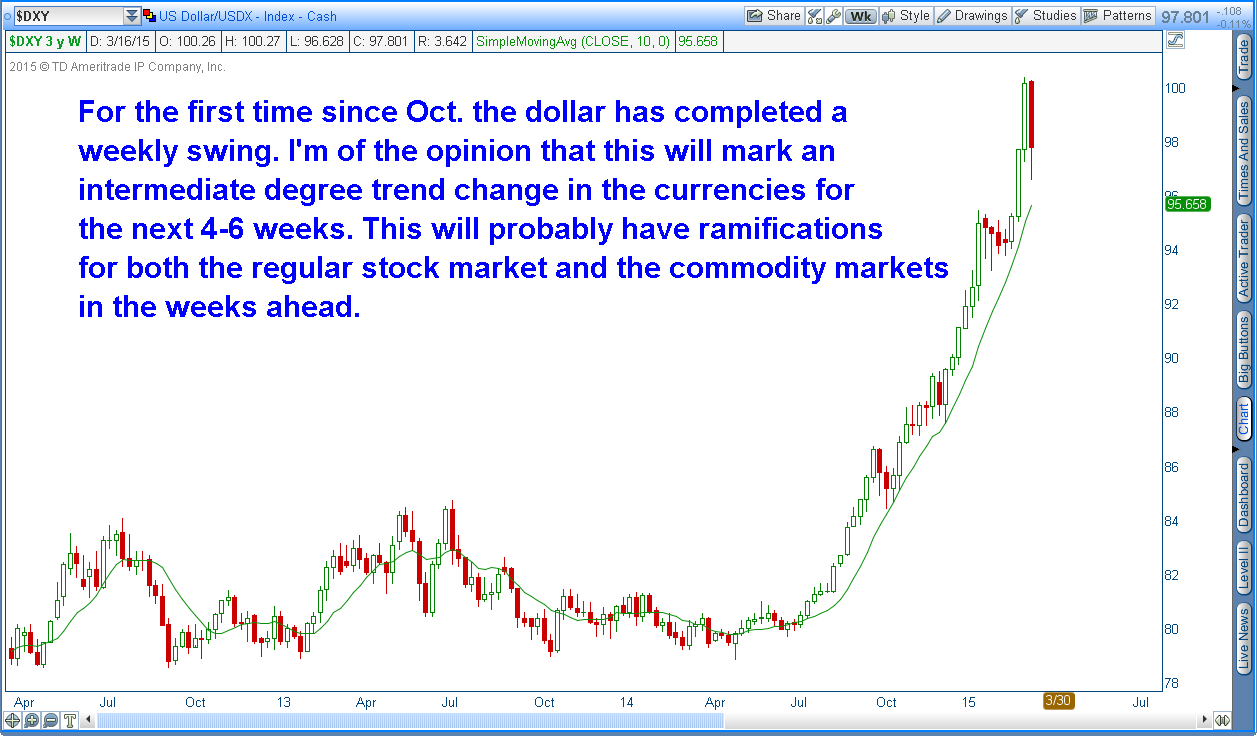
I’ll cover those ramifications in the weekend report.
CHART OF THE DAY
PREPARING FOR THE NEXT BEAR
So with the advent of global QE, and zero interest rates, have central banks unlocked the key to perpetual bull markets? Let’s just say, I doubt it.
They have managed to stretch some of the multi-year cycles, and hold off the bear much longer than most have anticipated, but I don’t think they have discovered the secret to infinite prosperity.
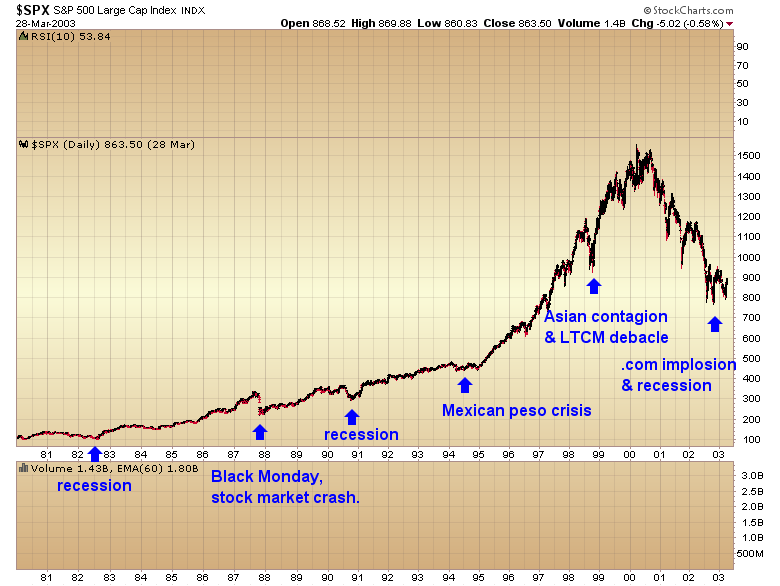
As I said, the implementation of global QE has stretched some of the longer term cycles, and that is the first thing I’m going to explore in this article. Prior to 2000 there was a very clear four year cycle in the stock market. Roughly every four years stocks would move down into an exceptionally vicious decline, usually associated with either a recession, or some kind of financial debacle.
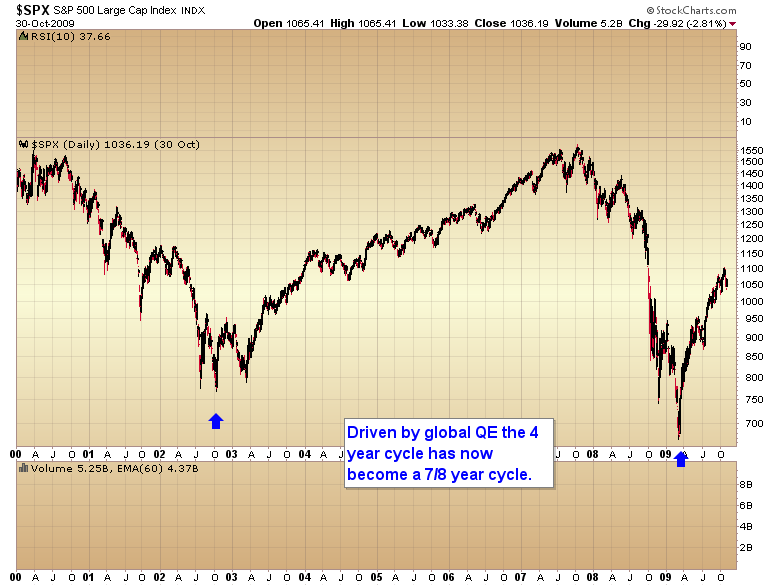
After 2002 central banks, in their hubris, decided that they could abort the normal business cycle by adjusting interest rates to zero and printing an infinite amount of currency units. At that point the four year cycle in the stock market morphed and evolved into a 7 year cycle.
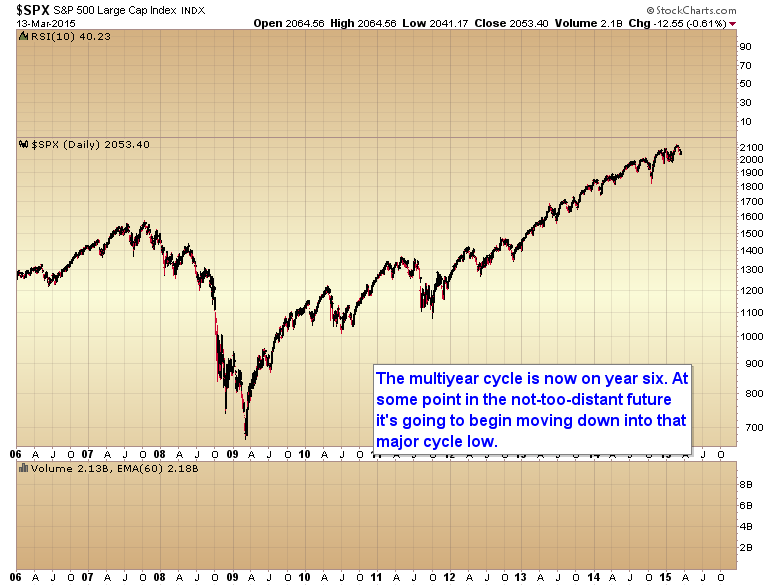
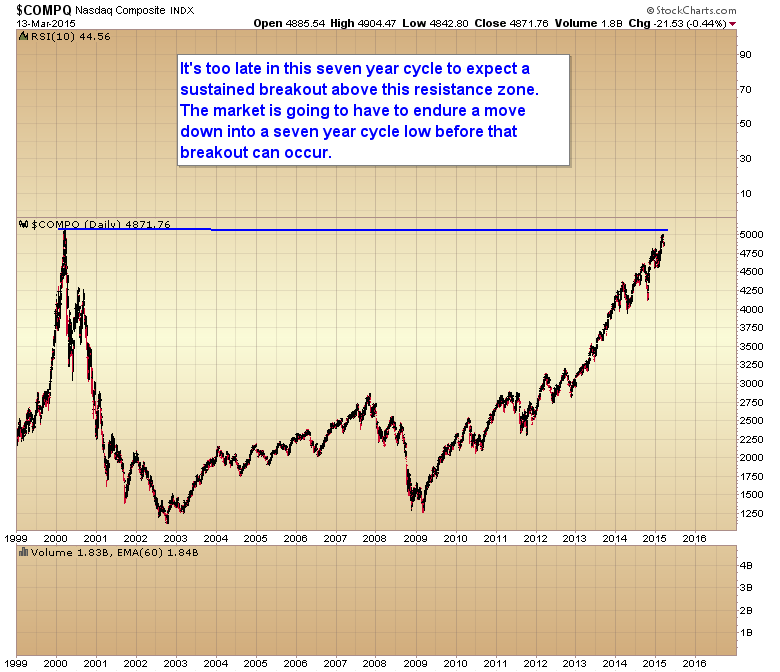
As you can see in the next chart, it’s getting very late in this seven year cycle, so we can probably expect the top sometime this year.
From this point on I’m going to convert to the chart of the NASDAQ as technology is driving this bull market, and the chart of the NASDAQ will tell us when to expect the top.
For more than a year now I’ve been saying that this bull market would not end until the NASDAQ at least retested the March 2000 highs at 5132. The perma bears that have been trying to call a top for years just don’t understand how major bull markets top. They almost always top on a breakout. Take the top in 2007 for instance. Notice how the market initially tested the 2000 high in the summer of 2007, and then printed a final top on a marginal break out above the old high (major bottoms also form in this pattern).
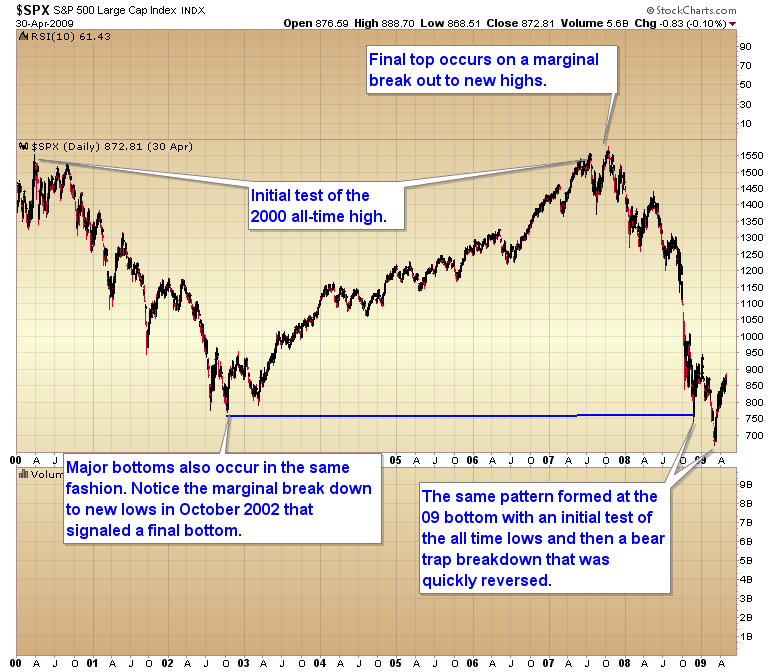
The big money institutions manufacture these topping and bottoming patterns as it gives them a breakout to sell into at a major top, and a breakdown to buy at a major bottom. Understanding how big money constructs tops and bottoms is critical in preparing for the next bear market.
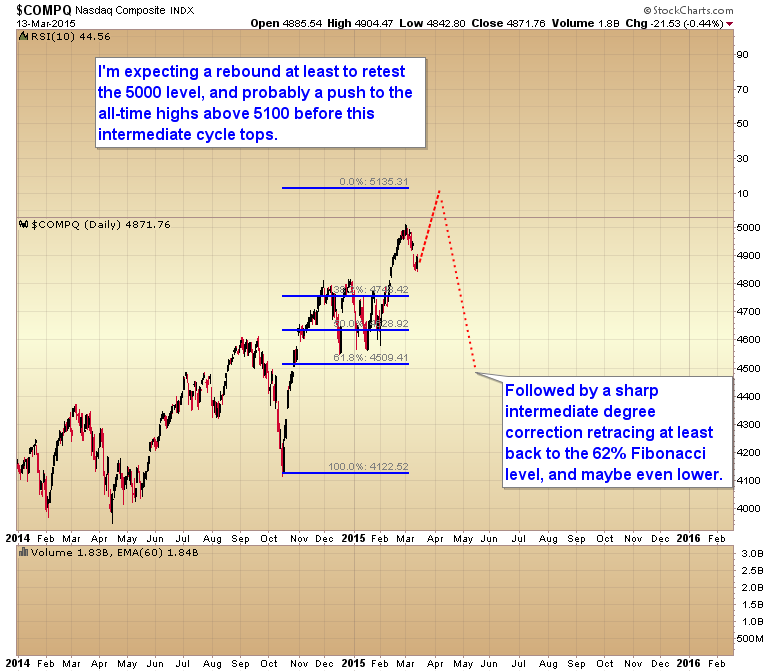
Given the fact that we are now six years into this bull market with the expectation for one of those seven year cycle lows sometime in the spring or summer of next year, then we can look at a chart of the NASDAQ and come up with a game plan for exiting this bull market. I’m guessing sometime over the next 2-4 weeks we’re going to get that retest of the all time highs, or at the very least, a retest of 5000. To be followed by a sharp intermediate degree decline.
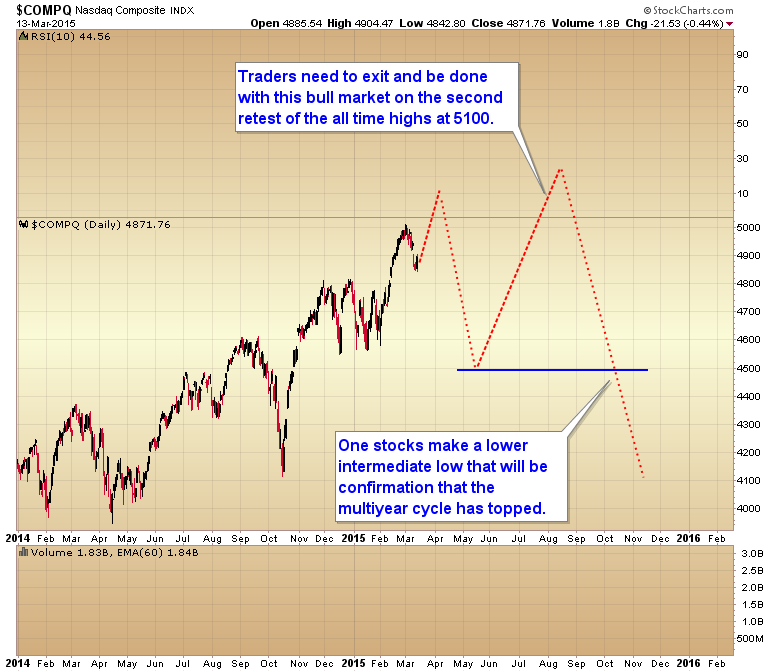
The bottom of the next intermediate cycle low in May or June is probably going to be the last great buying opportunity on the long side until 2016 (there is a lower probability scenario where the market just continues down into that intermediate cycle low over the next 2-3 weeks). As stocks come out of that yearly cycle low sometime this summer, this will be the period where the big-money banks manufacture a breakout to sell their positions in preparation for the move down into that seven year cycle low next year (economic conditions are already starting to weaken). We want to ride on their coattails for this last move back up, and then hop off the train before it goes over the cliff and the market starts down into its seven year cycle low sometime next fall.
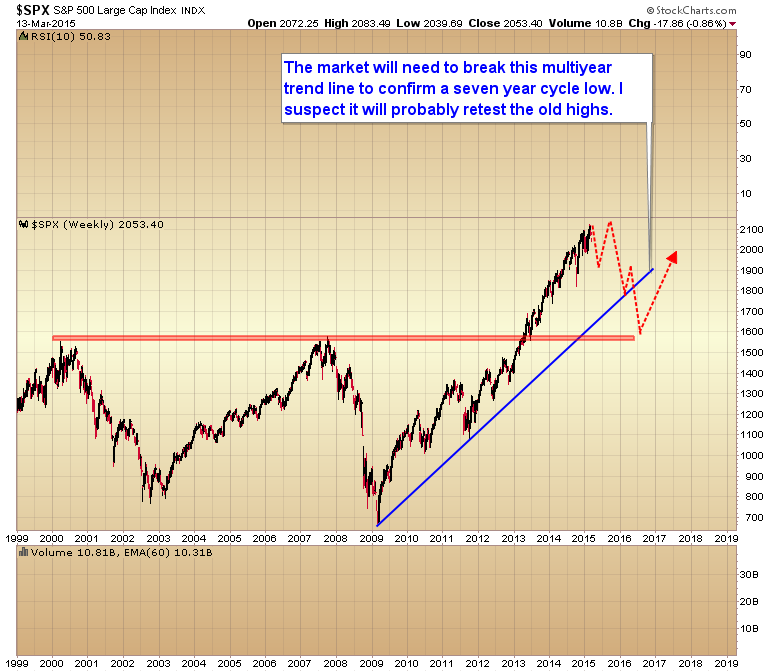
At this point it’s too late in the seven year cycle to expect a sustained breakout above the all-time highs, so I think we should assume that that major resistance level is likely going to cap this bull market.
Now what can we expect at a seven year cycle low you ask? I think I can say with a fair bit of confidence that the S&P will break the multiyear trend line, and likely retest the 2000 & 2007 highs. The bears will be calling for the end of the world, and a move back down below 666 by this time.
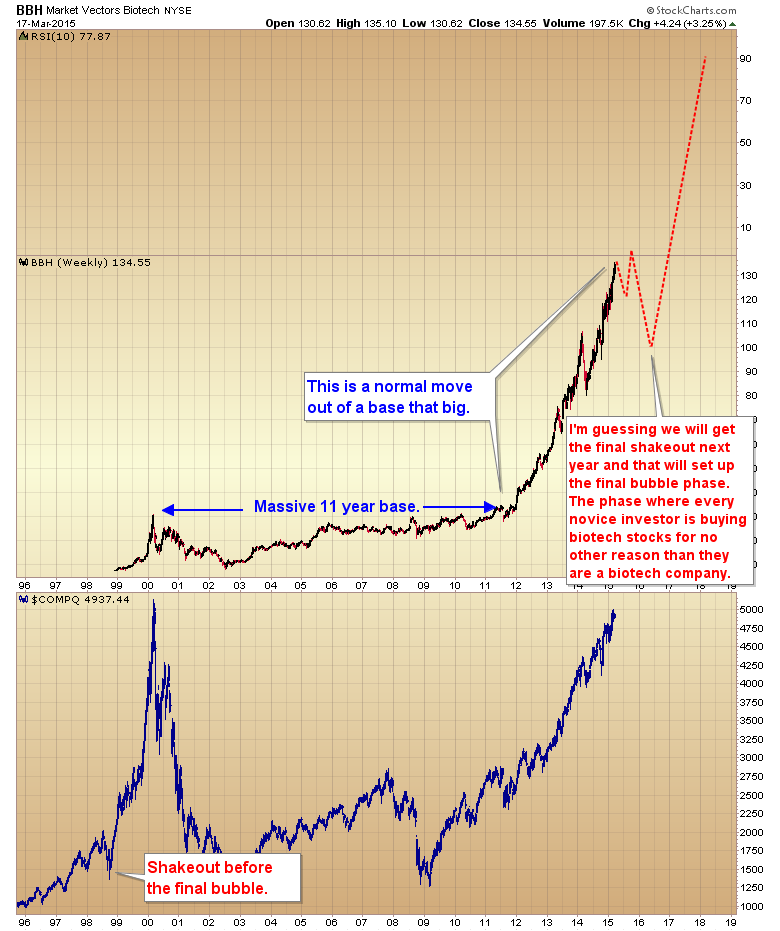
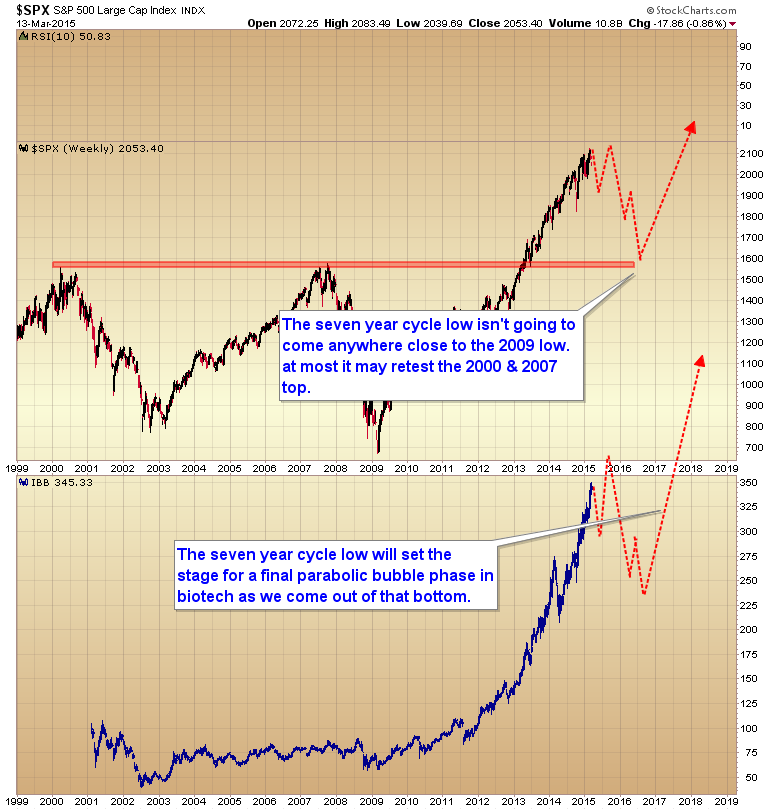
I think I can also say with a great deal of confidence that the seven year cycle low is not going to come anywhere close to the 2009 low. Instead I think it is going to set up the final bubble phase of this bull market, and that bubble phase will be driven by biotech. This should be very similar to how the four year cycle low in 98 set up that final parabolic run to the 2000 top.
And while I think the next phase of the secular bull market in gold will likely begin at that bottom in 2016 I don’t expect it will really gain much traction until the biotech bubble bursts.
So while I think bulls can make some good gains this year if they play the intermediate cycles correctly, I also think 2015 is the year to start preparing for the next bear market.
CHART OF THE DAY