Strictly Necessary Cookie should be enabled at all times so that we can save your preferences for cookie settings.
If you disable this cookie, we will not be able to save your preferences. This means that every time you visit this website you will need to enable or disable cookies again.
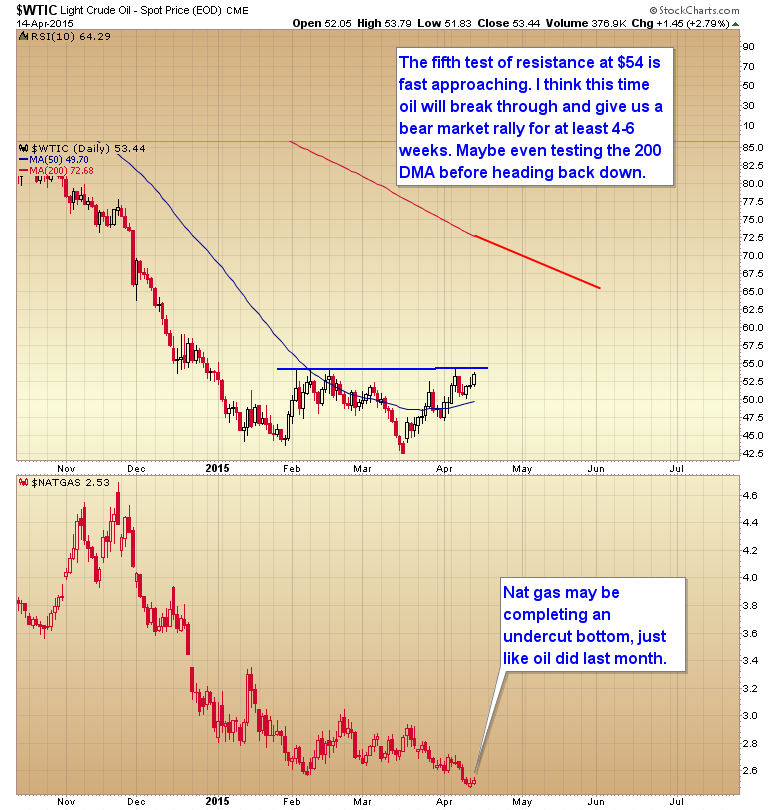
And there is the breakout I was looking for. Possible run to 56-57 before the next short term correction. Then a final run to 65-70 before heading back down.
We got in almost 4 weeks ago at the very bottom. Too bad no one believed me and have now missed the move.
Traders are getting the same undercut bottom opportunity again in nat gas. The same doubters and haters will miss this one too.
Just don’t buy UNG. It’s such crap these ETFs with contango.
I was considering buying UNG ted – doh!
Look at a 5 year chart comparing UNG and the price of Natural Gas. That will be enough to make your decision.
I am a Brit – didn’t realise you could buy directly into US gas prices? I thought the only way you could do it was via a gas etf like UNG.
Gary, please provide an opinion why the gold chart does not illustrate an “undercut bottom”, even though it is very similar in appearance, just over a longer time horizon, thanks.
It did hacve an undercut bottom, But like oil it’s not likely to be a final bear market bottom. Just the start of a nice bear market rally.
Brilliant call, Gary. I’ve been long oil since last week and sold into strength today. I’ll go long again on a backtest of the breakout. The entire commodity complex joined the bandwagon today, for big gains.
Might be of interest – some figures on US Natural Gas Production:
‘Quantifying the oversupply of US natural gas’
http://blogs.platts.com/2015/04/17/us-natural-gas-oversupply/