Strictly Necessary Cookie should be enabled at all times so that we can save your preferences for cookie settings.
If you disable this cookie, we will not be able to save your preferences. This means that every time you visit this website you will need to enable or disable cookies again.
Like your work, and market pattern analysis. But,
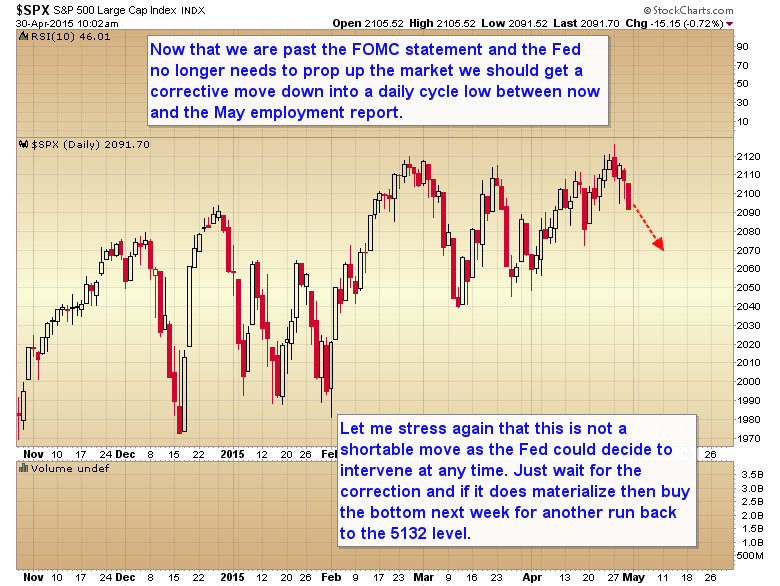
Maybe, the 5132 level was meant for the Nasdaq chart.
Bud
The Nasdaq is controling the market. that’s why i’m using that number. where ever the S&P is at when the Nasdaq hits 5132 then that would be the top in the S&P also.
Thank you, understand.
There you go, Bob UK. Patience finally being rewarded. Maybe. Let’s see if the 50 DMA supports this market or not. If we get a real move down into a CL, then we’ll have to figure out as we go along whether it is a DCL or an ICL. Either is possible, so keep your eyes open. In either case, it will create a nice buying opportunity soon.
And if we don’t get that clear buying opportunity, then I will still stay out. Just too late in the bull and in the IC to recklessly get in without a very clear CL to mark the entry and define the stop. When we get that clear CL, you’ll make enough money in a few weeks to make all the waiting worth it.
Roy,
The 50 MA sits at 2090. If we do have couple of closes below that then we could see 2025. However 2090 could be the low and we move to the 2116 again. I will not go long any time soon. who know if Greece exit the EU during the weekend, it will have a ribble effect world wide. I honestly waiting for $SPX to hit 1980ish.
Yes Roy – I am watching with great interest today.
Although, with a biotech that I have been watching reporting on Monday, I do kinda wish that the correction, if this is what it is, started a week ago 🙂
Does anyone care to comment on how the gold stocks are holding up today even though gold is down in the low $1180’s.
Look at $NEM 😉
We have just completed an Elliott Wave Diagonal Triangle since the Oct low. It was clearest in the COMPQX, but can be seen in the SPX and DOW and should take us back to the Oct low, at 1820 SPX – Quickly!
perhaps. If we close again tomorrow below the 2090, next week should be ugly and we could see 2040.
I am not a pure technical guy, I look at both technical and fundamental. If this plays out, it would mean earnings recession and cyclical bear (people may have slightly different definition) quickly to follow. And the only reason that it can happen is that the Fed does what it wants to do (to raise rate) no matter what.
Another nice call in nat gas – monster squeeze today. Glad I loaded up on BOIL Friday and Monday.