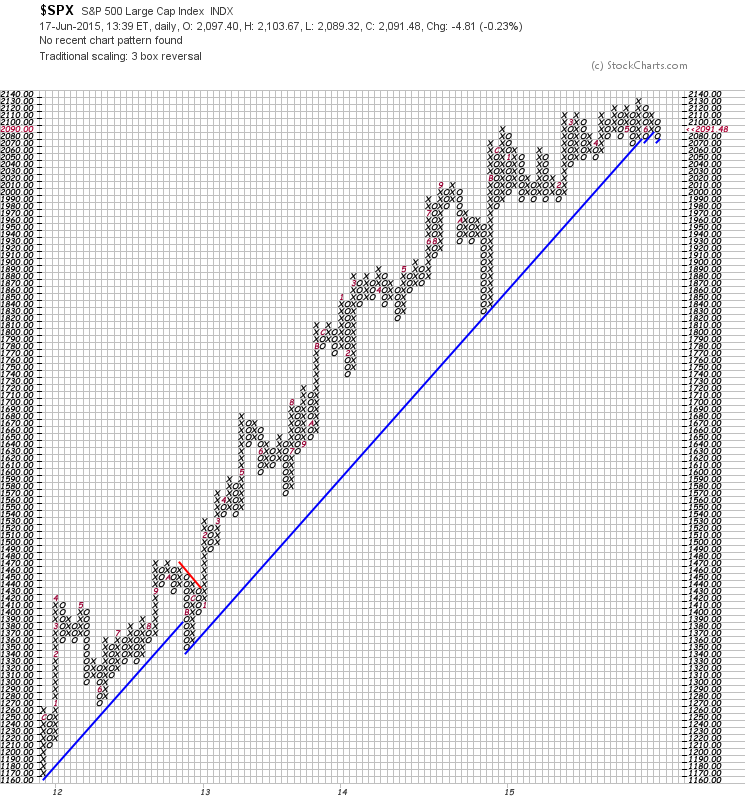
The point and figure chart is on the verge of generating a sell signal for the first time in 3 years. A tag of 2070 will start a down trend.
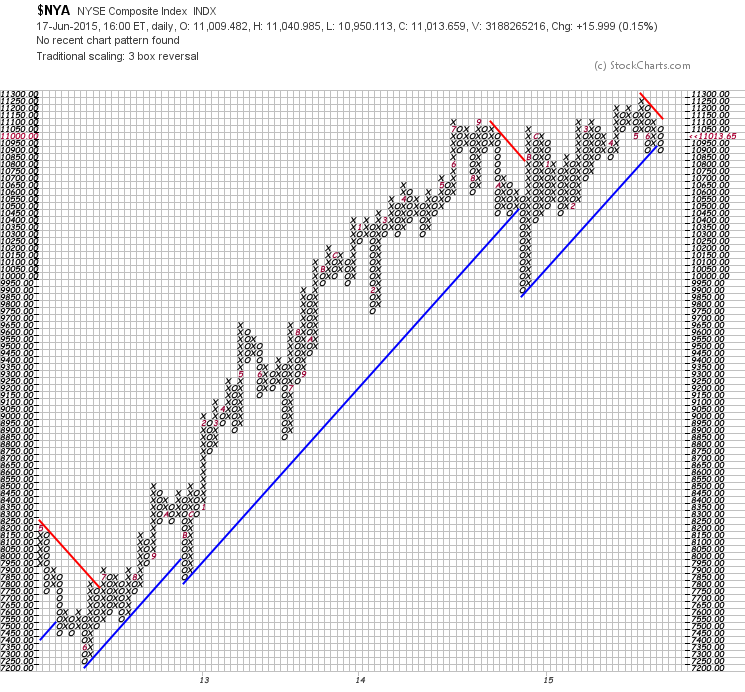
It’s much harder for the Fed to manipulate the entire New York stock exchange like they can in the S&P futures market. That index has already signaled a new down trend.
No raise of rates and S&P is up, but we are in correction mode according to cycles … maybe not a Grexit but there is a new concept in town Graccident 😛 they do not have the money to pay the lenders
And GOLD is up Gary 🙂 I say Gold, no new low and Dollar decline going forward!
Gold is up just like I said it would be.
It will not go below 2070 anytime soon. We will test the highs again and close the year at around 2300.
You are correct, New highs will happen, and 2300+ this year seems right.
yessir…..2300s r a coming soon!
I doubt it. The intermediate cycle it too stretched and the Transports are threatening to collapse. When they do they will take the rest of the market with them.
This has just been an artifically propped up market ahead of the FOMC meeting. Now that has passed this is the markets opportunity to continue the intermediate correction.
Gary, while I like your analysis on cycles. I think you are going to see a very stretched out cycle much like 1998-2000. So waiting for a correction does not make sense in this market.
Gold miners are very strong today with gold barely up. Do you still think this is another fakeout?
Almost certainly bait to lure in more longs before the bullion banks pull the rug out from under the sector again.
Crawford,
Gary provided a very insight P&F chart that points to S&P going down. I would stick with the charts. Countless of money has been lost thinking our own opinions are right while the charts obviously flashing sell now.
THE S&P is in a sticky range, and need to watch for a possible bounce or breakout.
The bull / bear market is still blatantly telling us we are in a BULL MARKET
so do not listen to the people calling for tops, drops, crashes, and everything
in between. This is a bull market, and has been like that for many years! I
have been buying the dips and making off like bandits!!
I do agree 2015 has been one of those years, where we are stuck in a range
but that does not mean a crash is coming, just in a coiling effect, before a
bigger move. I expect move volatility but my chart is telling me DO NOT
DARE FALL IN LOVE WITH THE DOWNSIDE!
I don’t really think we are putting in the top of the bull market, but we may be putting in a 7 year cycle top. Similar to what happened in 98 right before the bubble phase of the bull began.
Most bubbles need one big correction to clean the slate before the real fireworks begin.
Look at Nasdaq it has a very clear three wave pattern, we are waiting for a 4th wave correction followed by a final 5th going into 2016. Be careful the pattern in S%P is a distribution pattern, big sellers unloading imho.
What does that mean in English Stefan?
Whenever I ask Elliot Wave people about their waves they always seem very vague about where a 3rd, 4th or 5th… or an A, B or C… is up or down..?
I get the impression that these waves can be either up or down and then, AFTER the fact, they all proclaim that they called the market move correct?
Why can’t you lot just say that you think the market will go down and then it will go up… or vice versa…
Hi Gary, just found your site and it looks great. Good call on the gold rising on the fed meeting. I’m with you on the time frames, am a gold bug, but see a massive down move down into October. Post October, everything except gold falls off a cliff. Still don’t know if they want to hold shares up till then, been waiting for a 20% correction so long starting to think it won’t come! straight to the 70% crash. Cheers mate
Complete market breakout signals today! No reason to be a bear for a while. We are heading to new high!