Strictly Necessary Cookie should be enabled at all times so that we can save your preferences for cookie settings.
If you disable this cookie, we will not be able to save your preferences. This means that every time you visit this website you will need to enable or disable cookies again.
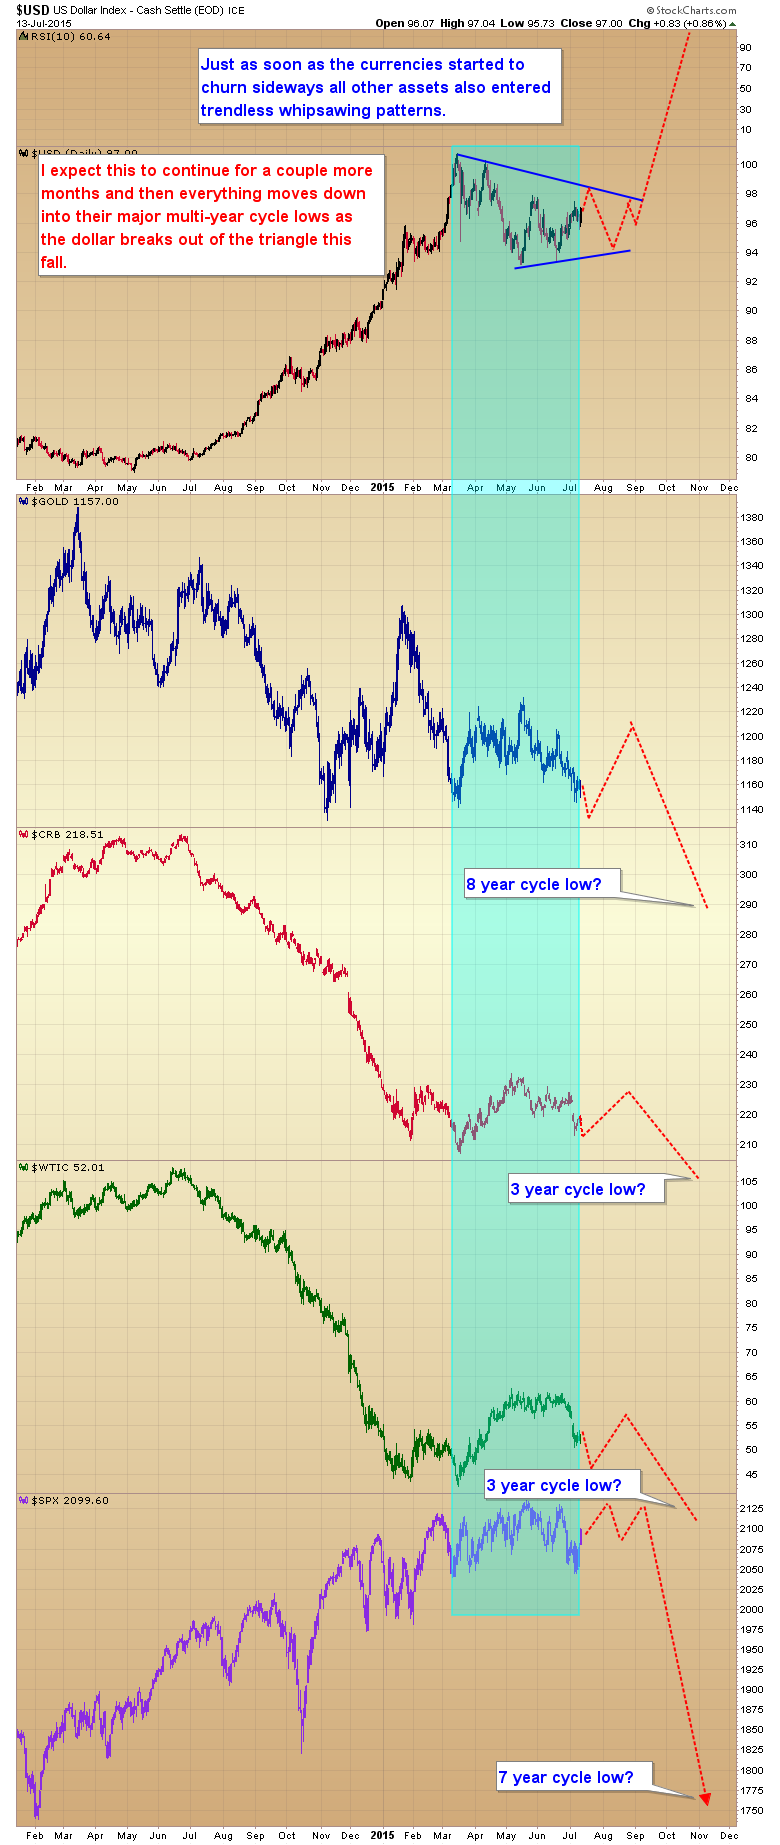
The world would pretty much have to end in order to see SPX 1750 by November. If we did see SPX 1750 (almost a 20% correction from the top), then stock prices would be the least of anyone’s worries! 😉
20% drops are quite common for major multi year cycle lows. They have to make traders think the end of the world is near to wipeout the bullish sentiment and set the stage for the next leg up.
Heck the drop in 2011 was almost 20% and that wasn’t even a 7 YCL.
I’m actually expecting a retest of the breakout at 1550.
If 1750 is the end of the world – 1550 is the beginning of a new mankind.
Janet Yellen speaks today at her semi-annual testimony. Any thoughts on gold here? Thanks!
Yes Gary a short rally in Gold&SIlver due to a weakening dollar:
http://www.chartfreak.com/2015/07/summer-rally-for-gold-silver/
I concur with Gary’s SPX forecast, many (3) analyst that I follow and respect has the same view, the Swedish analysts is very bullish though seeing, new ATH in the coming fall.
What about the (gold) mines? Oversold (daily basis) already.
Hej Stefan,
I am Swedish as I presume you are, and very impressed with Garys calls, which others analysts would you recommend?
Mvh,
Johan
Those charts are all scary – looks like the only thing to be in is USD cash.
The exception appears to be a short bounce in gold.
If the $ going to the roof then find assests /companies that will benefit.
Hi Gary,
If the Fed has aborted the IC decline and we now have a DCL, are you long stocks for the bounce or waiting for the bigger ICL decline down the road?
From Gary’s chart, the downside risk is far greater than the upside potential.
There seems to be nothing to do now other than to wait for the crash.
Dividends. It is all about watching the market do nothing and collect your dividends. Good names: STWD, RIO, BHP, ARI, PFE, VZ, GM, etc…Metals look like they could go straight down into capitulation any week now.
See the model portfolio in the premium site for our current position in the stock [ortfolio 🙂
Hej Johan,
Känns inte schysst mot Gary att rekommendera andra analytiker här, men kolla inlägget nedan:
http://www.stockhouse.com/companies/bullboard/v.gbb/gold-bullion-development?postid=23922602
Tack Stefan, håller med, inte så sjysst, sorry:).
Those charts make a lot of sense. The natural gas FCG chart is blowing my mind! It feels like it’s going to zero. It must be time for an across the board commodities bounce.
What’s your upside target for USD index? And expected timeframe