Strictly Necessary Cookie should be enabled at all times so that we can save your preferences for cookie settings.
If you disable this cookie, we will not be able to save your preferences. This means that every time you visit this website you will need to enable or disable cookies again.
Gary,
Have you noticed that cash held by mutual funds are very low at present abnormally low with a standard 2 deviation below average. Similar to 2007 prior to crash.
Gary’s outlook would be confirmed with price movement above 1162 in gold — my alternate scenario.
The other scenario: Resistance at 1130-1140 area will repell the current move up. We’ll get another slightly higher high in gold, ~1130 area, then back down she goes, for two more rounds of fun — 1030 area, and bounce, and sub-1000.
And THEN the larger degree countertrend rally Gary is calling for — to the 1300 area, perhaps.
Funny thing is, prior to Aug 7, Gary’s outlook was pretty much the same as described above. Then for some reason, Gary felt the dramatic move down pre-market somehow invalidated this scenario — whereas for me, it added to its probability, because it did NOT make a new lower low.
I would have been in the camp that says resistance at 1130 would repell the advance if the market had been allowed to trade naturally. By naturally I mean it should have bounced at support at 1130 and then broken through for a final cycle down to 1080 or 1033. But the huge manipulation on July 20th rushed the move down and may have prevented gold from making it all the way to 1033 during this intermediate cycle because it skewed sentiment too bearish too quickly.
The powers that be may have screwed themsleves by tryiing to force the market down to 1033 faster than it was meant to go. Now they may have to wait another entire intermediate cycle before it gets there.
I sold my miners this week and bought more physical silver instead, with lots of cash to add more. They’re just too volatile and the risk of a washout bankruptcy phase / capitulation still exists since we didn’t break 1072.
If this is the bottom of the metals bear market, great, silver will outperform most mining stocks in a bull market anyway.
Dan:
If you believe that you should elaborate and posts some charts to back up your stance on silver. I say this, because I disagree on this. Mining stocks will outperform the physicals in a huge way once a bottom is found. Silver has under performed almost every PM in long term charts.
From from bottom in 2008, silver went from $8 to $48 – XGD (senior gold miners) went from $11 to $27 only.
XGD went from around $8 in the early 2000s to 24 in early 2008 – silver went from $5 to $20.
Of course these include the real dogs like Barrick, and quality juniors would do much better, but you get the point.
Hi Gary,
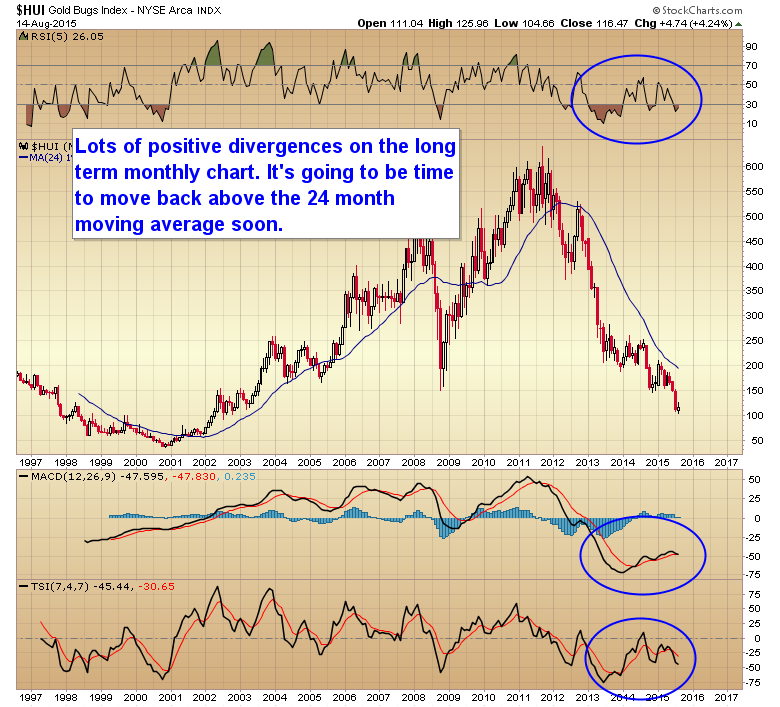
The problem i see here, however, is that there is no similar (monthly) positive MACD in gold price chart. Its MACD is flat while gold prices were bashed down since 2013.
Therefore, it could be just a very short relief rally in HUI at best?
By the same concern, if it is really a short relief rally in HUI, i won’t expect it to go pass 150 level, i.e a major resistance level for HUI…
Yes we may still have one more intermediate cycle lower after this one, but these are monthly charts, and on a very long term basis we are getting very close to a final bear market bottom price wise.
Could 41.35 be the 3 year cycle low in oil ?? Most of the Canadian patch went trough a bloodbath phase on Thursday and Friday , crazy new lows , but the big boys actually rallied while oil was going down …
Also some positive divergence on the daily oil chart between price trending lower but RSI making higher lows …. Signalling selling exhaustion and turnaround in sentiment.
Just my 2 cents …
Might be of interest re oil:
https://www.mcoscillator.com/learning_center/weekly_chart/pesos_message_for_crude_oil/
I’ve been saying for years, once the Fed raises rates Gold and PMs will have found their bottoms!
Hey Gary,
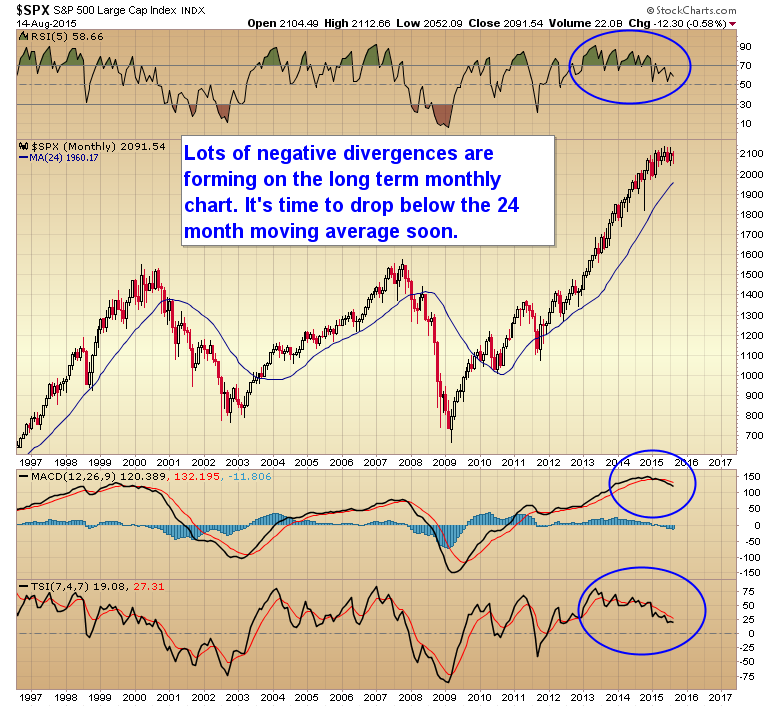
So from your chart above, it appears you are avoiding stocks altogether until we get a bigger correction down to the 24-month MA, correct?
Correct. Once the Nasdaq tagged the all time highs at 5130 I no longer want to own the general stock market.
That does not mean one should sell short. This is a rigged market and who knows how long the Fed can keep these interventions going. So sidelines is the place to be.
There is a solid roof at SPX 2120, the market just runs out of steam and finds it hard to get past
this level, every time we get up there. The SPX has a ASYMMETRICAL TRIANGLE DRAWN!!!! We will at least test 2120 again, maybe this week.
I bought calls in the NAZ, SPX and GDX.
The SPX could consolidate for a few more months then continue its assent.
One should focus on the dollar. It looks like a halfway pattern. Consolidating sideways after its big bull move. If that happens, look out below for PM’s.
Yes, there will be no market correction. Period. Sideways this year, and up next year.
SPX and NASDAQ and the DOW: The dreaded correction that will NEVER come…As Gary said it is a rigged market …………every time market gets serious on the down side, teh Fed’s Plunge Protection team rushes in to stop it ….as they did in Oct 2014 too
Gold: I am not as optimistic on any bounce above 1130-1150 area…this thing wants to go down and with crude oil on its way to teh 30s, where can Gold really go?? but down.
Watch GDX….if it close above 15 we are heading to 18.
I don’t see that happening, unless Gold goes to $1200
Looks like the dollar is bouncing off of the 50DMA.
Only 56+ points south until Schiff’s prediction (from a few years back) of the USD index dipping down to 40 becomes true. 🙂