Strictly Necessary Cookie should be enabled at all times so that we can save your preferences for cookie settings.
If you disable this cookie, we will not be able to save your preferences. This means that every time you visit this website you will need to enable or disable cookies again.
Sentiment on gold is among the lowest readings of the last 40 years. And the COT is back to extremely bullish levels. Shorting should probably be reserved for day trades only at this point as a cycle bottom could form anytime, especially with the dollar nearing the recent highs. Longs are going to start taking profits and selling dollars into that resistance zone. A breakout is unlikely on the first try and not this late in the daily cycle.
everybody is long dollar throung fx, us stocks and us bonds so going long gold is such a sort of insurance for all these position pro-dollar. But net position on gold could go negative like in the 2000’s
http://www.bing.com/images/search?q=cot+gold&view=detailv2&&id=464A47ECBF06C18D2AFB646CC3F01E5CC1021549&selectedIndex=253&ccid=1VBgHK5y&simid=608000428829772460&thid=OIP.Md550601cae728709ccdbf1c7be8885d8o0&ajaxhist=0
No sooner did I type this than both gold and silver rocketed higher and are printing reversal candles.
Keep typing……
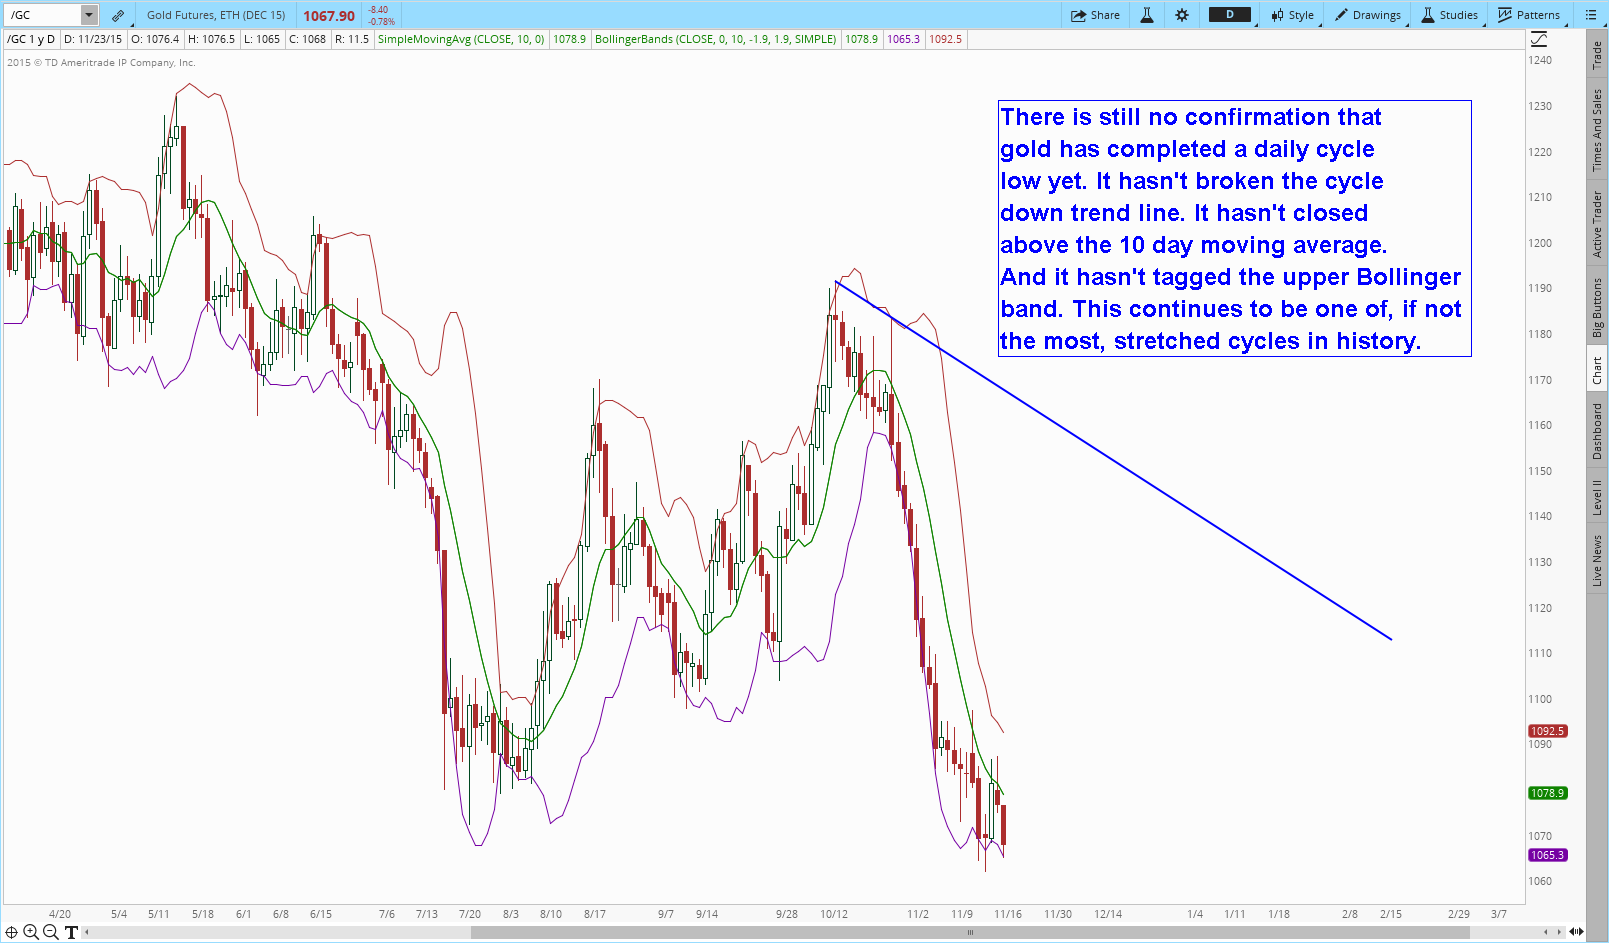
To me, a more obvious conclusion is that gold has fallen out of its recent cycling pattern.
It has evovled into a 28-40 day cycle. Too many traders started trading cycles so the market figured out it could fleece these traders by stretching the cycles.
The market eventually breaks every system.
.. and all bets are off for the moment.
The place to be right now is in the stock market. It doesn’t make a lot of sense to fight with the erratic commodity markets at the moment.
Capitulation?
I would like to see a bounce first and then one more cycle down in Dec.
took positions on UUP and DZZ with tight stop losses just below prior DCLs: 27.68 and 8.48 respectively.
Gary does the $GOLD:$WTIC – Gold/Oil Ratio have any usefulness in these manipulated market? Thanks.
It will usually regress to the mean at some point.
So many idiots here. Some short gold with a tight stop. Some long gold with a tight stop. I am long with a tight stop. All got no balls. Lol
Based on charts, I dare not touch PM. No indication of bounce. Very oversold. But oversold can get more oversold. Only long bit bcos of cot.
I only got balls for stocks with a wider stop. Cos in the money.
Yes David, i ‘m one.
The market fluctuates with the idiots’s sentiments.
Any ideas on the GOLD/OIL Ratio?
I long some crude due to its impulse move. And becos of that, also long bit of gdx. Bcos, who knows, crude could drag PM up…
After Transports Index last week now, consumer discretionaries’ XLY in bearish divergence across the board.
Intermediary cycle low in early January at some 1950 for SPX clearer by each day!
Long so little commodities, with stops, yet fear it like hell. Long so much equities with wider stops, yet feel so relaxed. The big irony.
Short the bounces in crude.
” He who laughs last, laughs best. “
or: bravery is uplifting and charming; that’s why heroes have monuments risen for [post-mortem]
Maybe the cycles don’t work anymore to a market that is manipulated.
discretion is the better part of valor 🙂
🙂 hello, hello, Z!
just added to UUP and DZZ as USX broke to new high and totally ignored a dovish housing report
G’day Alex!
Interesting — I agree with your intermediate outlook.
In the nearer term, I’m on my way to a few hours of sleep before checking back near closing time…
good sleep there, Z!
taking turns: by the time you wake up, I will have tucked in too 🙂
Gold looks like 1976
$USD to 70 next 3 yrs
Nov 23 PM sector big green light & low risk entry setup… CliveMaund
look for big volume on gdx, over 100mil shares one day, that is the bottom
July 20 2015. 150 million shares.
The bottom is in.
http://schrts.co/nnsPxn
you don’t understand, it is always a heavy volume day to get gdx to reverse a direction.
to move out of this correction it has to be a 100+ mil day.
if you see 50+ mil trade before noon that is the day to buy
Morris Hubbartt said that on Friday .. 321gold
Everything seem to be put in place !
uSD fluctuated around 100 —> more & more “idiots” (like saying in the above postby David) believe in the immediate Up trend.
Gold choppy around 1070 peu-importe what people say & charting & doing various TA —> more & more flip-flop 1000, 900…. Like Pros.
Not imminent !!! Market taught all idiot one COMMON Lesson : Idiots do not have PATICIENCE.
Thanks
Gold: No. Oil: No. Stocks: Hell, Yes!
Wake me up when gold has a weekly close above $1178.
Same old song. Weekly lower lows and lower highs.
http://schrts.co/5UzjZM
Well, it’s nice to see GDX grace the Buying on Weakness page for once:
http://www.wsj.com/mdc/public/page/2_3022-mfgppl-moneyflow.html
Don’t see gdx on this list – See GLD on ‘Selling on Weakness’ page though.
DXY – Beware and be aware of the “negative divergence” in “daily RSI”…since Nov 6th.
Thanks William
cheers!
Agree Bud!
You can play shorterm SWing too !
China, SHSZ300 Index is looking to “hammer” on its daily closing…
Gold, 60mins chart is attempting the test of vertical downtrend line from the peak in Oct…
Hey William!
Not sure what conclusion you draw from your comment on gold’s trendline above, but you’ve got me re-thinking my analysis of gold’s consolidation since Nov 11 — could be a running triangle, for instance — so cheers mate!
What i mean is that the post the run-up from Sep. to Oct’s peak, gold’s 60mins downtrend line has pretty much capped the prices…and as i type now, it has just broken-up the downtrend line and testing this resistance, much like it did on Nov 20th (but failed then)…
So, if the prices can hold above this resistance line tonight, then, it will be constructive for positive price action in coming days!
And, yes, SHSZ300 close the day with a small hammer…so, prices should be positive tonight for FXI and YINN, with more upsides in coming days!
@red
Why do you think that the pattern could match 1976 behavior
thx for answering
William,
Ah, yes, now I see it (back home, with mouse plugged into my notebook). I have been using that trend line for a while now, on my 2-hr chart. Looking at upward targets of 1080 & then 1100.
But without the mouse, I had to look a little harder at what you were talking about on my gold chart & a possible triangle popped out at me. I’ve been wondering about that for a while. So I’ve added a flatter, more recent possible triangle upper trendline — connecting the peaks from last Monday (1098) and Friday (1088) — see if it holds.
Then I remember non-farm payrolls on Friday… & Yellen on Wednesday.
If this consolidation is a triangle, then the move down should be five waves down to end the move down from September, 2011, followed by the more extensive, multi-year, bear market rally that people are talking about.
Bottom line is, I’ve been looking to go long since Friday — so far, I’m glad I have not!
Cheers!
Yup, am totally out for now!
In fact, gold at the moment resembles May 1999 (i.e one month before rate hike in June 1999) where gold price put in a lower low…
After the rate hike in June 1999, it dropped further and bottomed in August and then rallied 29% in September…that was the original bottom of gold prior to another test of August’ low in February 2001…
Miners, on the other hand, did not make a lower low in May 1999 and went flat from June to August and then rallied more than 50% in Sept. 1999 before dropping another 65% to bottom in Nov 2000…
From a pure candle-stick perspective, however, gold still needs a “daily hammer” to confirm an interim low prior to any sustained rally…like the one on July 24th.
Otherwise, don’t touch it at all! 60mins’ chart is too short a time-frame from margin of safety point of view!
William,
I skip the hourly chart on the round the clock securities — as you say, it’s too short. I favor dividing the day into 12 candlesticks, which is greater than the sample size I use for my SMA and Bollinger Band studies, so the final intraday candles may end up in a different wave pattern than the earliest on any given trading day — doesn’t lock my intraday analysis to strict adherence to trading days. I believe the 2-hr gives me the most accurate signals for my BB & slow stoch settings.
For securities that trade during market hours, the 30 min chart is the best choice for me — BB signals for GDX are excellent for my settings.
12 or 13 intraday candles give me the cleanest signals of minute degree trend change.
From there, I use the 3 min chart for GDX for minuet degree. 10 candles per 30-min candle.
When the daily (minor), minute, and minuet degree signals are all aligned — that’s usually a good sign!
Die, stocks broke some support. If took out day low, will have to sell to lock in profits. But what a nice rally in gold, silver. The war risk after Russian plane shot down could propel gold.
Moral of story, try not to fight COT data. Odds is no good fighting them.
Now it’s commodities’ turn to bounce and relieve their hyper oversold condition on geopolitical headlines, while stocks fall back down to reality.
Eventually they will all get sucked in to a deflationary panic, the only question is whether SPX finds support at the 2013 breakout or we go all out to 600-700 like contrarianadvisor says.
Hopefully man. I am long gold, silver, oil. Hopefully that market doesnt stop me out of my index. Missed by a tick and I would be stopped out.
The ugliness in Dax is its 3 day island formation, and its MACD daily kiss of death. Touched upwards, and was rejected.
USD again showing its strength. Rejects another opportunity for a decent sell-off.
If gold and silver can only muster such rally on war risk and market sell off, how to be bullish in them?
Weekly swing low comfirmation in crude:
Long crude
Sold US stocks
I sold stocks, but have to buy back. Underlying strength is too strong to ignore
I hear ya, US Indices basing here for next run up.
I think crude has a bigger run up potential.
Market bears, be very careful here. A breakout is coming soon!
?? why the market so exited, ignoring bad housing data + today’s consumer conf., as AlexP said max to 2104 then I look for shorts, 70% in cash now…
China is roaring with FXI and YINN…
I could be very wrong on this, but, i won’t long the USD here…
https://www.linkedin.com/pulse/usd-watch-top-william-yii?published=t
Have to agree Will. That is nowhere near an 80% probability (only trades I’d take) and in fact looks like it met resistance at 100 pierce/pivot and is pulling back. Having not been in this game for a couple of years I don’t feel qualified to comment with any weight, but enjoy yours, Gary’s and a few old mates analysis just to keep the mind a little ‘with it’ as much as one can without being in the shark tank 🙂 There is then the DT which is massive if you get consolidation now but you may not. You have to let pattern and time do it’s thing here.
yeap, William, it is a high probability now, and that would also be a healthy move for the up-trend, that USX will shake out weak bulls (and enforce bears’ smiles “I told you so”) during this week by coming down to 99.10 and lingering around there for a few days before springing next week.
Technically, besides leaving aboard only strong bulls and raising bears’ futile conviction, the fall to 99.10 would also help validate bearish divergences with oscillators, depress oscillators, thus providing a fresh start for the next leg up.
I think crude oil is having a very high probability that its August’s low was the final low…
https://www.linkedin.com/pulse/crude-oil-real-william-yii?published=t
The boost in Gold is nothing more than a dead cat bounce.
The chart has been in a downward facing channel and trading below its 100-week moving average for the last two years. So I expect gold prices to continue to move lower within this channel and probably
accelerate to the downside coming out of that channel, but maybe that will not happy until 2016.
Gold can fall to 850 in 2016
Yes 850 800 600 … What else !!
We can make money on both side Up & Down.
Time & Price
*William, it’s not the USD you’re worried about – It’s fiat currencies. There are worst run currencies in the world – The ringgit (where you’re based) is a good example.
So the Q you should ask yourself is what do you hold instead?
William most of the energy ETF’s are not exhibiting daily swing lows but some like crude herself have weeklys!
Cheers bro.
Made a stupid move Sunday night and placed an open sell on my beloved crude longs from Friday oit of panic before taking a flight only to be not aware of the OPEC announcement so I messed up big time on Monday!
Bad timing.
Correction:
All daily confirmations
we are on day 5 of gold’s daily cycle –> new daily cycle has been rather covert because of USX’ steep trend which lent it further to gold on the inverse.
even though USX may touch 99.10 this week, this would be a constructive action for USX’ next leg up.
the way USX has been correcting delivers more and more obvious data that THE SAFEST PLAYS ARE LONG USD & SHORT GOLD (for the next 2 weeks) WHILE THE RISKIEST IS ON STOCKS UNTIL JANUARY!
get on board before it is not too late! now the green back is cheap and gold still very expensive (but too expensive as some see it below 700 in the next months)
…. I plan on selling my UUP and DZZ on the first sign of distribution after the FOMC.
With ECB’s Council in 1 week, jobs report and then FOMC to deliver the rate hike, USX will go parabolic and gold will dive into 3-digit area !!!
DO NOT MISS THIS OPPORTUNITY, GUYS! the more fearful you feel about getting on board long-dollar & short-gold, the more you should be confident that you are doing the right thing.
AS A PSYCHOLGICAL PROOF THAT I AM RIGHT, TAKE THE STANCE OF LITERALLY ALL PEOPLE (EVEN GARY, WHO JUST DID NOT CALL ME A FOOL 2 DAYS AGO FOR THE CONFIDENCE OF MY OPINION) WHO WOULD REFUSE TO LONG THE DOLLAR AND SHORT THE GOLD. Doing otherwise is not contrarian but gregarious.
No way I would short gold with sentiment at 17% bulls and the COT at bullish extremes. And with a daily cycle that is one of the longest in history. This is the same kind of sentiment we saw in the dollar in March right before it topped.
Day trades only if you are going to try to short gold this late in the cycle.
But with all of these bullish indicators you only show a bounce in $gold to 1120. And how come not mapped to at least 1190 like last rise from August when we had same indicators? Thanks
William,
Thanks for the long term dollar purchasing power chart!
Any chance you could post a quarterly chart for gold, 1913 to present, on SEMI-LOG scale?
That would be very telling!