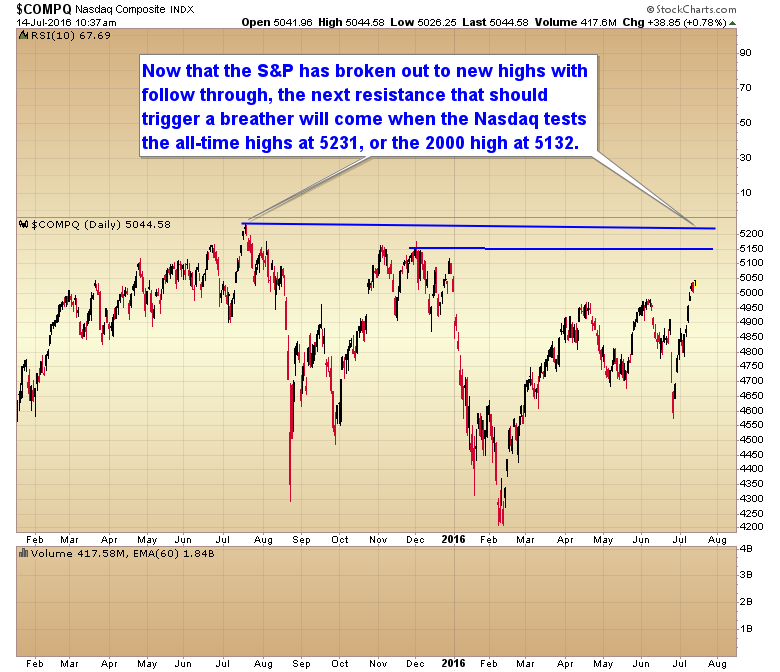
THE NEXT RESISTANCE ZONE
Now that the S&P has broken out to new highs with follow through, the next resistance that should trigger a breather will come when the Nasdaq tests the all-time highs at 5231, or the 2000 high at 5132.
Like our new Facebook page to stay current on all things Smart Money Tracker
I wouldn’t pay much attention to that weirdo Nasdaq. S&P and the Dow are in a rising (unsustainable) wedge, once it’s breaks down out of the wedge a minor correction will be due. The last uptick to get to the top of the wedge (around 2175-2180) could be caused by good Q2 results tomorrow.
In the next 1.5 weeks the market will focus a little more on politics, due to the big conventions. Maybe the Nasdaq can uphold itself a few days into next week, because of Nasdaq-companies reporting Monday and Tuesday, but that would be it.
Get it through your head. The 7 YCL is behind us. The bubble phase is in front of us.
Put the memory of 2009 behind you. It’s not going to happen again.
And allow yourself to make some money off the next phase of the bull market.
And for heavens sake quit trading off chart patterns. If it was really that easy every retail trader with a stockcharts subscription would be a millionaire.
The intermediate trend is up (clearly). It won’t top until at least September. The Fed is dumping too much money into the market to keep it propped up ahead of the elections.
The breadth thrust off the February bottom and the June bottom were two of the most powerful in history. That is not a sign of a market running on fumes. The last time we saw breadth readings similar was coming out of the 09 bottom.
Are you thinking past 5200?
May be, but rut is beginning to stall. Nothing goes up in a straight line. Rest of the upside could be tricky.
All GAPS need to be filled.So eventually there is going to be SELLING coming to close these gaps.
lowest is at 4800.
VIX is back at support at 13.
Not all gaps fill. Look at the gap in January of 2013.
Because it is so early in a new intermediate cycle I expect the S&P to hold the breakout and I think there is a good chance the Nasdaq holds 5000.
I’m whining simply because I underestimated the power of this advance and I hate when Mr. market fools me like that. Yes I understand it is Central bankers doing this, as the so called smart money is still fleeing the market. Yet “up” is up and it’s up without me.
Smart money got in at the bottom of the correction. Dumb money is still trying to short this market.
The Nasdaq is going to at least 20,000 before this is over. Most dumb money retail traders will try to short it all the way up, just like they’ve been trying to pick tops since 2009.
TCL daily cycle low in spot gold today ?
I doubt it. DCL’s usually don’t bottom until they scare everyone into selling right at the bottom. As long as traders are still buying it’s usually too early.
I read yet another bullish article on the biotechs today. It seems that many of the analysts are following Gary’s lead on that sector. Amazon is one stock to watch closely and it is showing signs of buyer exhaustion.
Just short term. Quit trading short term, and just get on board for the intermediate trend. No top until at least September and maybe October.
All major etfs: udow,upro,tqqq,tna are sky high. % profit from here to your resistance lines could be tricky . I am out and will stay on sidelines and leave the arena to folks more talented than myself.
Gary is right, we were also way overbought short-term for a while when we came out of the bottom in February. The same could happen in this ICL
I wouldn’t be counting on Facebook and Google to be pushing the market higher. They both have scary looking charts and have been under performing since the S&P breakout.
This is going to end really bad soon! Be very careful imo.
Financials is not confirming this breakout, European banks are in dreadful shape, Japan and US not in much better shape.
Are we going to witness a 1929ish crash?
You will be looking for the next crash all the way to 20,000.
Face it when central banks are printing trillions & trillions of currency units the risk isn’t of a crash, the risk is in creating a bubble.
Just look at the last 16 years.
It is looking like Alexandru Popovici made a great call on TLT . Bond yields are rising rapidly. I have been buying TMV for some time but TLT has to drop to 134 just for me to break even. Unfortunately, TMV has a high slippage rate although not near as bad has NUGT.
Don, yeap. Incidentally I got now a first look back on the blog in a couple of days and I saw your comment on me 🙂
Also take a look at TTS, BEAT and GIMO.
yes, slippage is larger in NUGT because the underlying asset has a larger volatility than TLT – the underlying asset of TMV.
pls do not mind my observation but it is a matter of time until you kill your trading equity if you allow so large losses to accumulate.
Very small losses + large profits + antimartingale pyramiding are the keys of successful trading.
For instance, 2 weeks ago I was preaching the fall of the market and I bet short stocks twice but I allowed only -0.2% equity loss on either of the trades, -0.4% cumulated loss (easy to overcome by any even sub-optimally profitable trade) whereas since last week I am riding profits.
Ahhhh if only it was that easy. I’ve seen many a trader destroy their account with tight stops that just paper cut them to death over time.
but why s there slippage ?
referring to NUGT and so on..
NUGT uses options extensively to achieve it’s triple rated performance. Options experience time decay and that contributes to the significant slippage of NUGT as well as JNUG over time.
I see. Thanks !