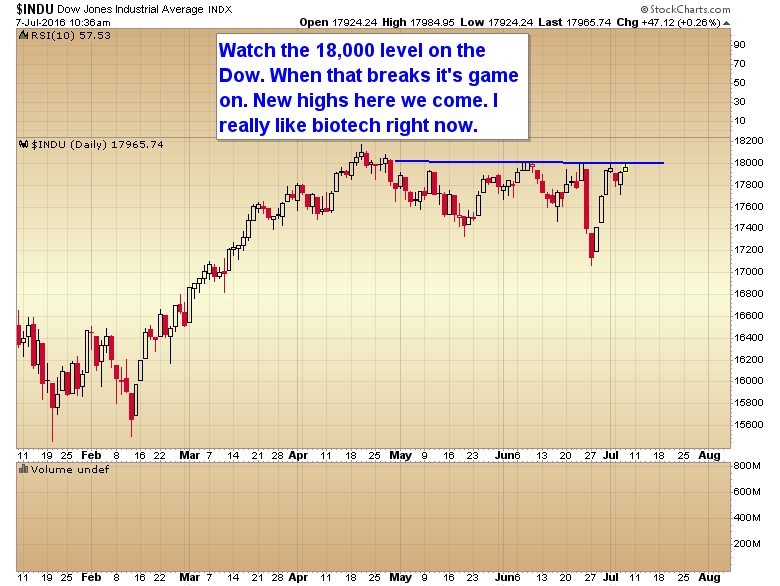
WATCHING DOW 18,000
Keep your eye on the 18,000 level of the Dow Jones Industrial Average. When that breaks it’s game on. New highs here we come. I really like biotech right now.
Like our new Facebook page to stay current on all things Smart Money Tracker
Crude Nazi is being a bad boy today, no 18,000 for you!! Come back ONE WEEK!
Not convinced that Tuesday low was deep enough to start the next up leg to new highs.
The typical idiot retail trader buys high and sells low. I buy low and sell high.
Biotech is low.
That means it’s time to buy. There have only been a couple of times in the last 16 years that the monthly chart has been this oversold. They were all great times to buy.
Retail traders can’t trade against their emotions though so they never catch these opportunities.
Gary,
Using EW, I can see the A-B-C correction. But why do you think that the correction is over for the immediate short term? I was expecting a further correction this year in SM and then we have the huge reversal uptrend. I can understand that we could revisit new highs but I was thinking late 2016 early 2017. What tells us that the correction is over? I am open minded to learn. What else do you use to determine the direction of the markets. I give you lots of credit for being courageous. I am thankful for getting an opportunity to watch you in action. .
Gary,
With the Biotech’s, correct me if I am wrong, you are playing more of a long term trend for the next 18 months – 36 months. I can understand you.
The 7 YCL occurred in Feb.
Gary,
Can you reiterate your views on crude? Last I checked it was a retrace to mid $40s with a return to $50-$55 range.
Possible intermediate cycle top. I’d look for a bottom either on the 200 DMA or at the 38% Fib.
One by one, it’s taking turn topping…
Oil first.. Then gold/silver.. Bonds and now waiting for stocks.
FWIW – The RUSSELL 2000 has really had a struggling time lately. But if you zoom back to the weekly chart, you will see that we could be forming what looks to be a MASSIVE or MAJOR head and shoulders pattern. IF that is the case there is not a reason to get excited yet, as the right shoulder is forming and that could be messy, volatile and takes weeks to PLAY OUT!
TOP traders are not bullish at the moment, this does not mean the market cannot go higher, but when you see some of the smart trader shift away from new exposures, and more on the SELL side and then you mix that with technical … something is not adding up, and this market is really having a hard time moving forward, and the bulls are still a bit scared!!!
For every bull out there, there are 3 bears….and they might start to growl soon, if this BREXIT stuff comes back to haunt us,it feels like the calm before the BREXIT 2.0 storm.
If there are so many bears, don’t you think the contrarian would say BUY?!
Yes I am still carrying my 20 VXX Jan 2018 60.000 call (VXX180119C00060000) @ $.90
Gary,
–
I’m feeling more comfortable with a double leverage biotech such as BIB for a longer term hold to get the most out of the rise in the future ( 1 yr).
–
Would BIB be appropriate for a longer term hold? I would suspect the decay is less.
–
Any other thoughts from the community on this?
You can’t hold leveraged ETF’s long term. They have decay issues during ICL’s. Long term you will have to stock with XBI, IBB or BBH.
LOL!! Dow heading for NEW HIGHS probably by end of the day!! Gary was correct me thinks.