Strictly Necessary Cookie should be enabled at all times so that we can save your preferences for cookie settings.
If you disable this cookie, we will not be able to save your preferences. This means that every time you visit this website you will need to enable or disable cookies again.
I am shifting gear here also.
I was long convinced this year that the larger 7 ish year cycle had shifted this year from stocks to commodites.
I lifted on commodities with both oil and pm’s earlier this year for insane profit.
However if you zoom out more and look at the longer term highs and lows its starting to look more and more like both pm’s + oil and other resources are stil in the downward trading channel and almost all commodities had its large intermediate cycle high a bunch of weeks ago.
If this confirms we are looking at way lower oil , pm’s and other resources for a new bottom after which limited central banking power globally (eu and japan already at rock bottom only helicopter money remaining) will triger the final event of massive deflation in assets and eventually a bear market in stocks but we aint there yet it seems.
It stil seems like the leading global indices (the american ones stil) have their leg up power stil due to central banking.
Which would also mean that this isnt the start yet of a large commodity bull cycle.
We have just seen the intermediate cycle highs in commodities.
I am anticipating to shorten commodities more and go long assets.
Welcome to the club, Gary. No perfect indicator. Oil has been looking ugly for the past several days. Using USO as proxy for oil, oil is in a down cycle. No idea when the turn is going to come. Predictions may not always pan out.
Unfortunately until yesterday nothing out of the ordinary was happening. Just a normal HCL. Then the sell off on Wednesday was much more aggressive than I anticipated. I gave it one more day just to be sure, but when the selling just accelerated today I decided something was wrong.
What a difference two days can make.
Maybe there will be a dead cat bounce in oil if the dollar tanks tomorrow. To be safe probably best to sell on that rally and take the loss. Oil is out of play after that steep selloff so early
Wti could be forming the right shoulder of the large inverse H&S formation…
Would be nice to see a normal correction in stocks.
We will see $60 WTI by year end.
The market is tightening and the stock drawdowns in 2017 will be humongous.
Hi Gary and everyone! I am long in oil with big losses because i believe in 60 until the end of the year…
But i have to ask for an advice if anyone can make… Should i keep my positions? Where is the next big resistance? Do you thing is going under 42? My cash is now limited for new placements in oil… So or going out with big losses or stay and pray :). Thanks keep up the good work!
I became nervous yesterday when the selling that started on Wednesday accelerated. Now oil is at the mercy of the PPT’s ability to keep the stock market propped up and prevent the normal drop into a daily cycle low. If that happens then oil would be under even more pressure.
Anyone who was watching intra day chart for erx/uco would have noticed oil entering a down cycle 5 days or so ago. Nothing happens at once without showing up on intra day charts first with rare exceptions. You are a very talented analyst, Gary. Probably, you were preoccupied with writing your blogs. Anyway, oil is experiencing a bounce. Have no idea how far it is going to go. There is no perfection in this business.
On weekly charts, nice hammer for nugt, jnug, etc. So, this has the right feel for a significant low for pms. Watching uso closely. A trend change likely when uso hits 10.5 to 10.6. Time will tell. Cheers.
ALL RIGHT!
DCL in stocks yesterday on day 47!
I am thrusting to buy oil stocks and regular ones for over half of my cash now at the open and the rest on Monday’s follow through.
TIME TO BUY OIL AND STOCKS IS HERE!
There is no room for pessimism, just buy.
Ok Alex. Already neck deep into China ADRs. No time to look at the rest. Since u say oil stocks, ok. Buying into some GUSH, OIH and PSX. Let have good luck
pms are a better buy. A nice hammer on weekly charts. Oils are experiencing a bounce. On intra day chart, price is still below ichimoku cloud, -ve. But, moving averages are turning up, +ve. So the situation is still fluid. Uso experienced a complete retrace of last upswing. This is quite common. I am not negative on energy complex.
Gary — wondering if you agree with the preceding comments by Alex P. re DCL in stocks and time to buy energy/oil stocks? Thx.
There seems to be multiple typos in this post:
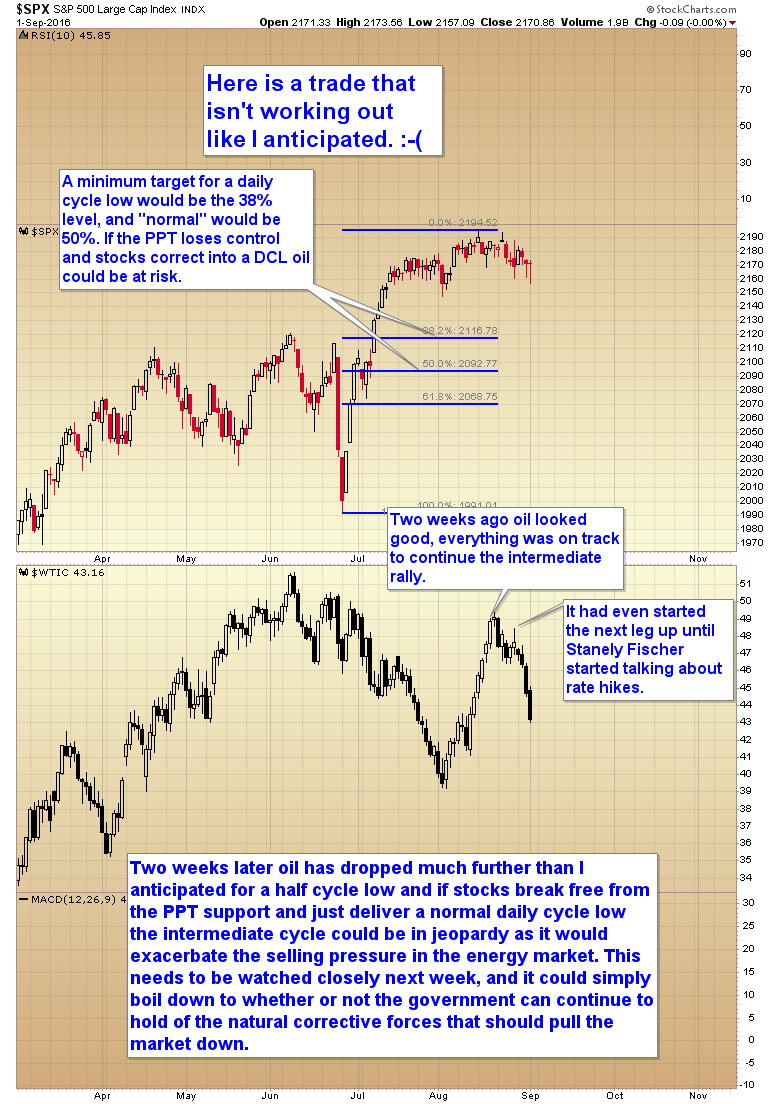
“Here is a trade that isn’t working out…”
are u kidding me??
Chris, Chinese adds look like good investment targets, at least as diversification, since these assets benefit the UNCONCEALED, even outspoken touting of the deep-poketed treasury of the Chinese govt.
Thank you for the tip.
PS. Anyone looking for leads, transports and Russell have confirmed new daily cycles, transports particularly leading the advance since they have diverged positively lately – DCL in transports several days ago
My oil plays ERF and SDRL bought today at the open are acting swell 🙂
Planing on upgrading ERF to a full position on Monday.
ERF bought at this time makes a standard example of my targets as part of my trading strategy.
Going to sleep. Good night!
This is no dead cat bounce in the miners btw…
Absolutely. VERY strong hammer on NUGT weekly. It can not get better than that weekly. Cheers.
looks like DCLs across the board and everything is headed up. buying on Monday.
thanks Gary and Alex.
Whoever said gold is going to 1000 has got to be kidding. We will never see that in our lifetime, if ever.
On another note, silver bottomed on August 25, 2016 on my TOS charts and according to FTC, silver will now trend higher until about April 17, 2017, when another correction will take place. After that, it is up, up, and away. This bull market in gold and silver will last several years. So, you better get on board before the train leaves you behind, and while the prices are this low. Yesterday, gold and silver rocketed higher, especially silver, and took out some important resistance levels. Don’t believe in those analysts who say gold and silver are going lower. They are absolutely wrong, especially Larry Edelson, Harry Dent, and others.
Russell leading all indexes to a new high. That’s very compelling.
Yesterday, meaning September 2, 2016, on Friday. I’m in a different time zone. It is now September 3, 2016, for me.
XAG I have the DCL on 8/29..
I guess its the different indices that we are looking at.. spot vs. front month futures, further out months. also currency effect when the spot metal prices are observed in different currency denoms.
in a different light, am seeing more analysts calling that the current precious metals bounce a “dead cat” variety, which is to top by 1,355+/- 1,365 region, for a revisit of the 1,200+ region.. spot gold.
You are so right. I’m referring to the active month, which rolled over during that time. The spot price did bottom on 8/29 at about 18.37.
My financial mentor predicted a 20% drop this month in Spx a year ago, but ever since he has been quite bullish on the stockmarket lately. I am on the sideline with my pension fund. I will wait and see how September and October unfolds first.
Gold and Silver is just fine, waiting for a top mid/late 2017
Many people on the sidelines in Sep-Oct I believe, and that is of course a bullish factor in itself. Might it be that the seasonal bearish factor is now too ingrained to be of value anymore…?
My thinking is that they need a reason to fire up the moneyprinter again. A big drop in US markets would trigger a continued moneyprinting process going forward. Propping up stockmarkets with moneyprinting to compensate for declining production capacity in the west.