Monthly Archives: October 2011

GOLD AT A MAJOR CROSSROADS

I think next week will mark a major turning point in the gold market. Depending on whether the dollar continues higher or turns back down we will either see a resumption of the D-Wave decline or this will just turn into a normal run-of-the-mill intermediate degree correction followed by another leg up in this 2 1/2 year C-wave advance.

First the pros:
The COT report has now reached a maximum bullish level on the commercial contracts. In the past this has always marked major bottom turning points.

Sentiment & breadth have reached extreme bearish levels (contrary indicator).

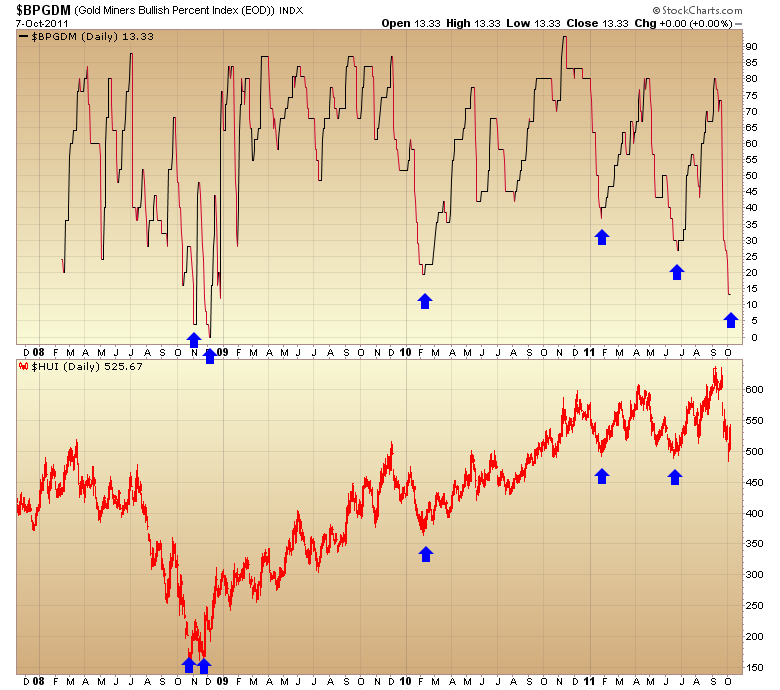
Chart courtesy of sentimentrader.com
It’s possible that gold has formed a small T-1 continuation pattern (A move followed by a sideways range often precedes another move of almost equal extent in the same direction as the original move. Generally, when the second move from the sideways range has run its course, a counter move approaching the sideways range may be expected.)


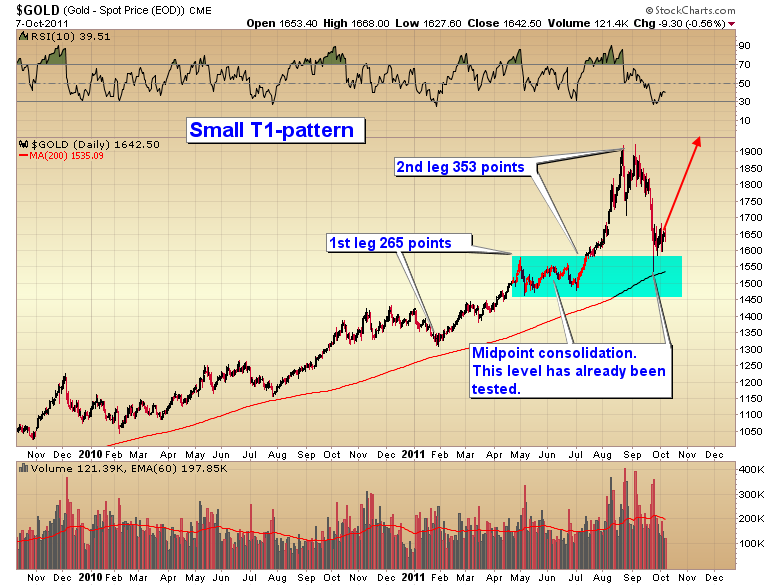
There is a small problem with this interpretation as the second leg of a T-1 pattern is generally slightly smaller than the first leg.

The cons:
The current intermediate cycle is too short. Barring a shortened cycle, which does occur rarely, there should be one more leg down into the normal timing band for an intermediate degree cycle bottom (20-25 weeks).

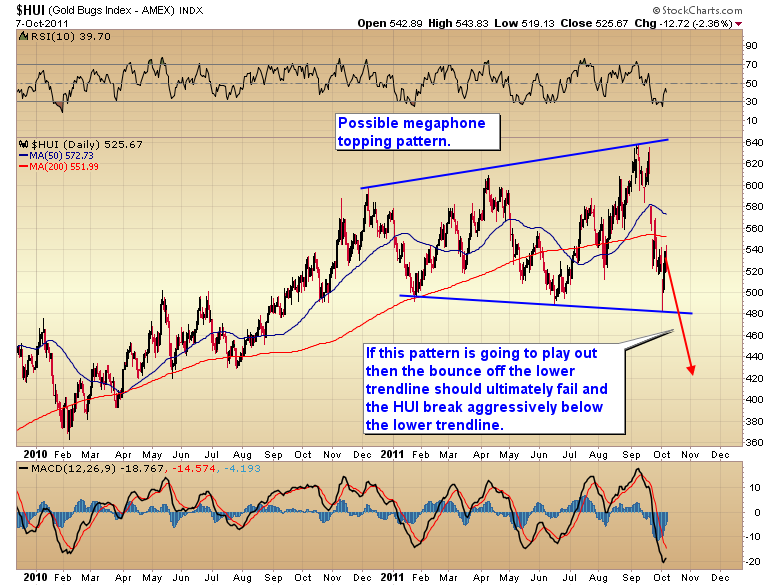
Also the HUI mining index is potentially forming a megaphone topping pattern. If gold does have one more move down into a true D-Wave bottom then the bounce off the lower trend line should fail followed by one more aggressive move lower.


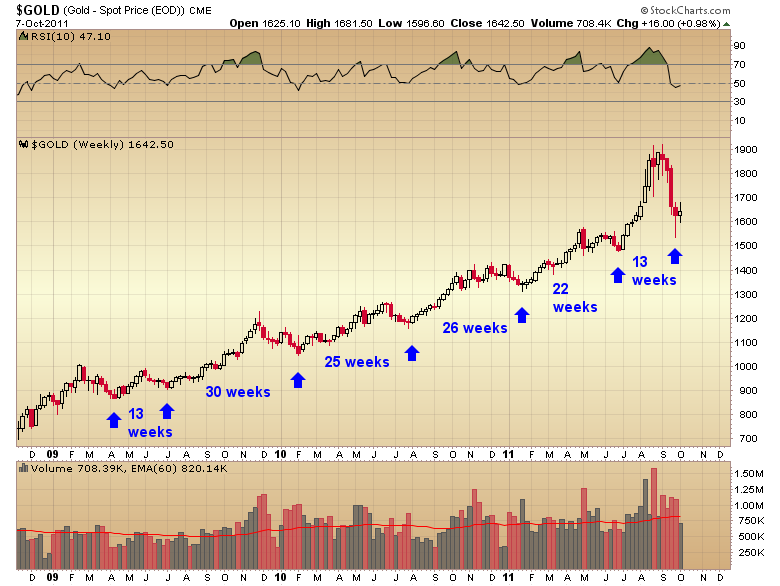
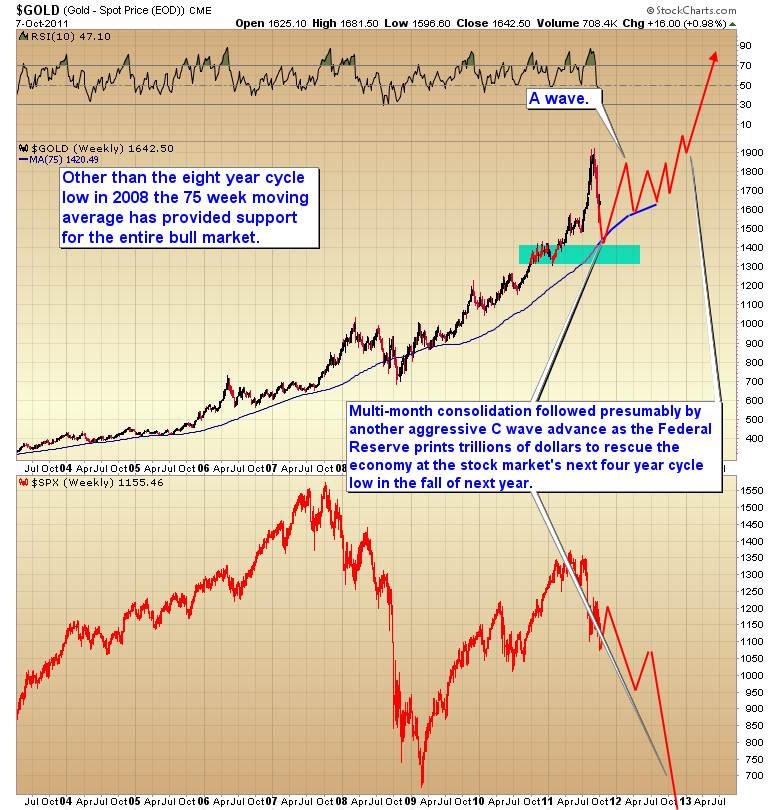
Also there is a much larger T-1 pattern in play that fits the normal parameters much better than the smaller version.


You can see from the chart above that unlike the smaller T-1 the larger version does feature a second leg slightly smaller than the first, and if this pattern is playing out then we need one more move lower to test the midpoint consolidation zone.

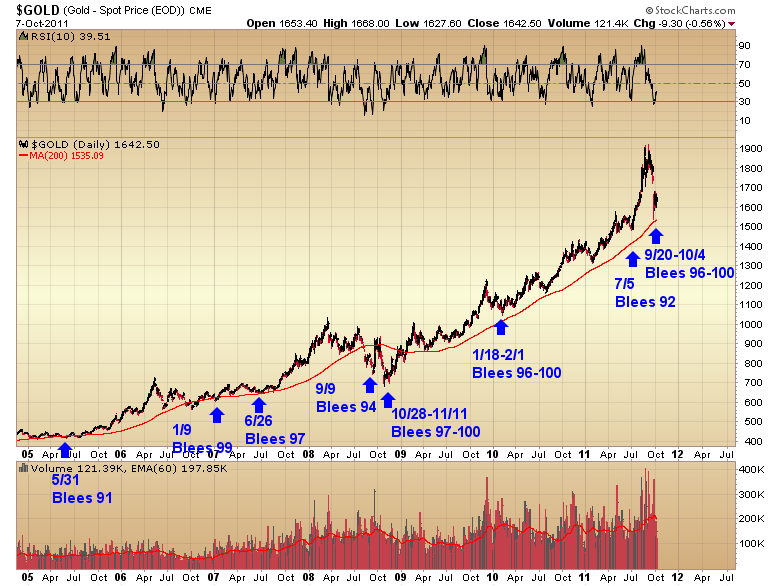
Right now the battle is being fought at the $1600 level. So far every time gold reaches that level buyers step in. 
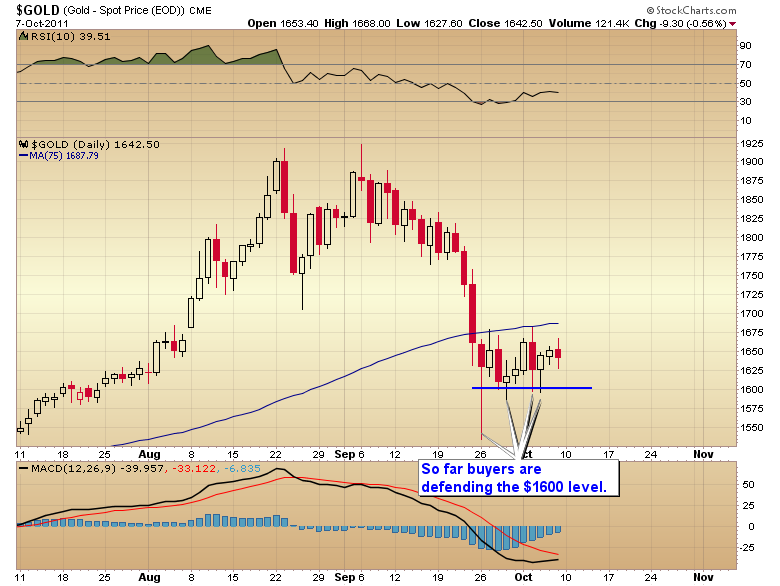
If however gold closes below $1600 that would be a serious warning sign that the current daily cycle will be left translated and that gold is indeed caught in a true D-Wave decline. If that’s the case it still needs to test the consolidation zone of the large T-1 pattern and the intermediate degree cycle will bottom in the normal timing band (November). If this scenario unfolds then we can look for an A-wave advance to begin once that final D-Wave bottom is in place.
As I have noted before A-waves usually test but fail to exceed the prior C wave top. They are almost always followed by a lengthy 1-1 1/2 year consolidation before the next leg up can begin.


In my opinion next week is going to be critical. Either the current daily cycle is going to break down below $1600 in a left translated manner, in which case we will probably see gold continue sharply lower to test the 75 week moving average and the consolidation zone of the large T-1 pattern. Or if gold can gain some traction and breakout of the recent trading range to the upside then the smaller T-1 pattern comes in to play and we should see gold make another run at $2000.

EUROPE TO THE RESCUE

It appears that the news out of Europe, right before the close, that the EU is looking at further measures to recapitalize the banks, was enough to halt what was likely going to turn into a very nasty drop into the employment report on Friday. Instead what started as potentially very ugly morphed into a key reversal day. Since the market was getting very late in its daily cycle this will likely mark not only a daily cycle low, but a greater degree intermediate cycle low.


I’ve noted in the past that these intermediate degree bottoms are often accompanied by a significant divergence in momentum. You can see on the chart below that this often plays out as a large divergence in the McClellan oscillator.


The market should now make another attempt at a respectable bear market rally. I would think a very minimum would be a return to the 75 week moving average.


And considering the amount of time the market has been consolidating a move back to the 200 day moving average is not completely out of the question.


I think we probably just saw a major turning point today. One that should mark a bottom for at least a couple of months.

I’ve had quite a few requests for a trial subscription link. The last $5.00 offer seemed to garner quite a bit of interest so I am going to add a permanent trial subscription offer. $10 for 1 week of full access to the premium SMT report. If you decide you like the premium newsletter your subscription will automatically convert to the yearly rate after seven days. If not, just cancel your subscription prior to your week expiring.

To access the trial subscription click here and then click on the subscribe link on the right-hand side of the homepage.

BACK TO THE BEGINNING

Bear markets are about cleansing the excesses of the prior bull market. Secular bear markets are about P/E compression, a move from extreme overvaluation to extreme undervaluation. The current secular bear market is now in its 11th year and in the initial phase of its third leg down.

As many of you know I expect next year to be one of the worst years in human history, at least economically speaking. Certainly on par with 1932 if not worse. This should drive one of the worst stock bear markets in history. Before this secular bear market expires we need to cleanse all of the excesses that were generated during the final bubble years leading up to the top in 2000.

I’m expecting at next year’s four year cycle low, which should occur in the fall, that we will see a true secular bear market bottom. That means single-digit P/E ratios, along with a dividend yields on the S&P above 5%. I also expect this leg down will erase all of the gains during the bubble years from 1995-2000.

However I don’t think we will be quite out of the woods yet. We will probably have to endure one more nasty leg down in this secular bear market before we put in an inflation adjusted low, likely it will occur in 2016 with a final bottom slightly above the 2012 bottom. At that point we should begin a new secular bull market that I think will be driven by truly astounding discoveries made in the field of biotech and nanotechnology.

But first we have to get back to the beginning.