Strictly Necessary Cookie should be enabled at all times so that we can save your preferences for cookie settings.
If you disable this cookie, we will not be able to save your preferences. This means that every time you visit this website you will need to enable or disable cookies again.
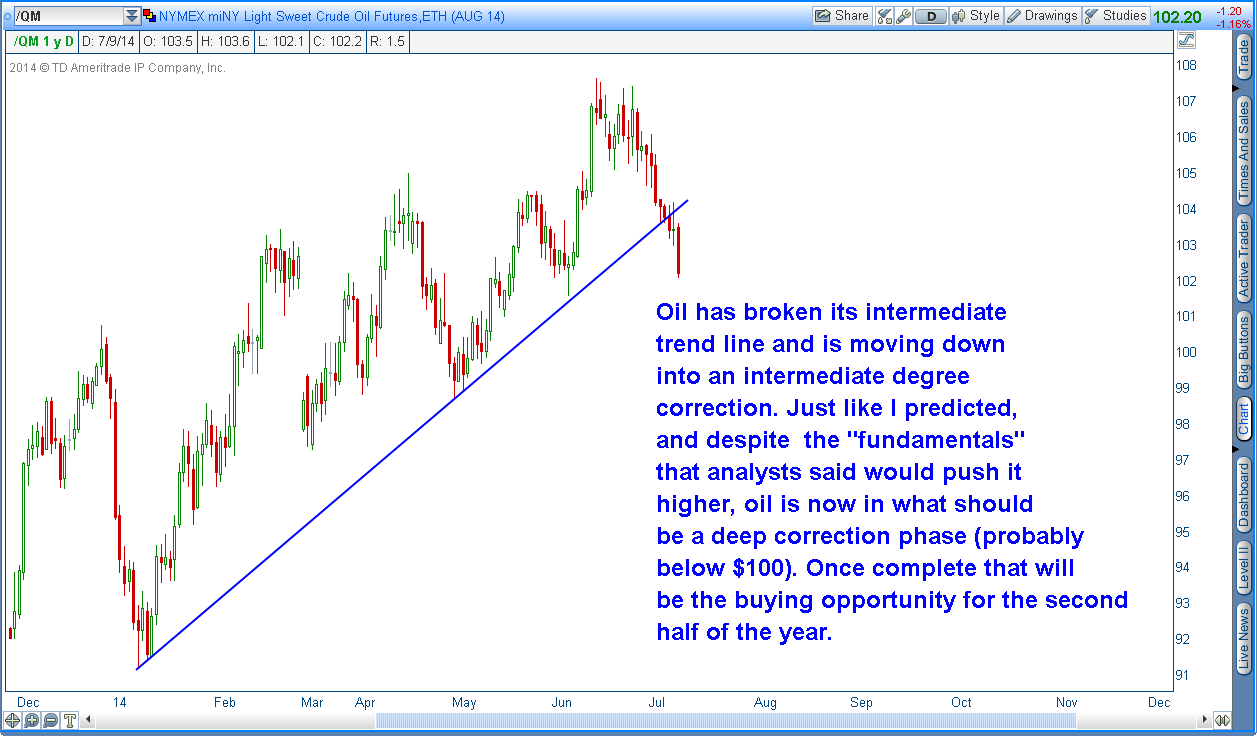
I drew a chart of my own and it shows a completely different story. In-fact it shows oil in a beautiful up-channel that goes back to December; the current price is now touching the bottom of the channel line and is oversold. Buy signal.
I usually like to wait for at least a swing before I try to catch a falling knife. Generally these intermediate declines don’t end until sentiment moves to bearish extremes. At the moment it’s about neutral. Typically an asset has to break a major trend line to wash out the technical traders before it can turn and go back up.
So I expect there are a lot of traders just like you watching that channel. Oil will probably have to take out all the channel buyers before it bottoms. As a matter of fact it’s already begun. You might want to stay patient for a while longer.
Just re-listened to the Korelin show on Monday. You specifically said you expected a correction down to $1280- $1300. Instead, we are now $42 higher than the $1300. and now your going to sit here and tell me you played it perfectly?? Whatever.