Strictly Necessary Cookie should be enabled at all times so that we can save your preferences for cookie settings.
If you disable this cookie, we will not be able to save your preferences. This means that every time you visit this website you will need to enable or disable cookies again.
Gary,
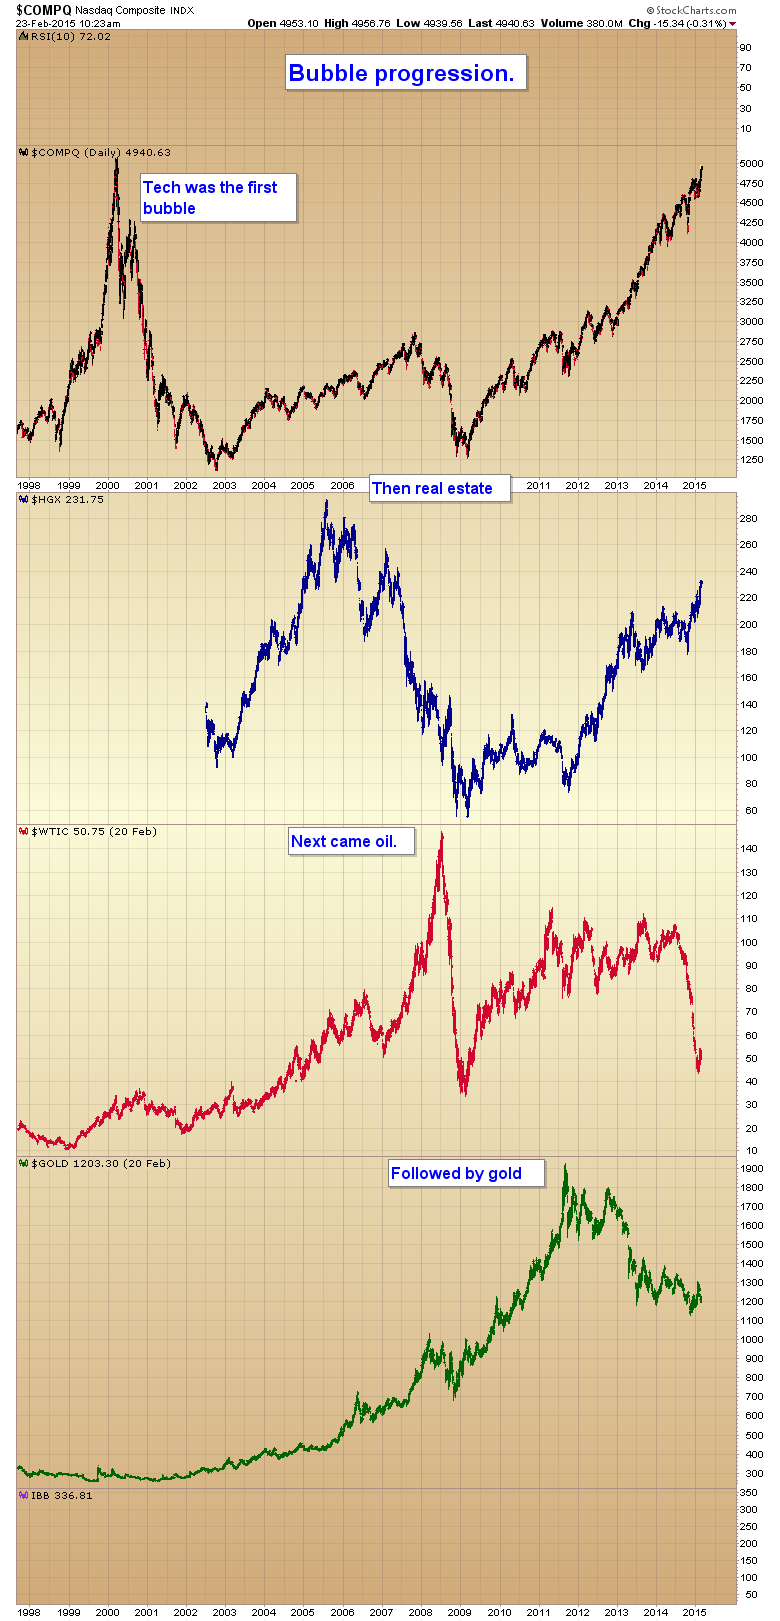
Shouldn’t gold need to go 700 and like Nasdaq in 2003 level from top? When bubble burst how much percent they give up from top?
I’m guessing gold will need to at least go back to 1000-1050.
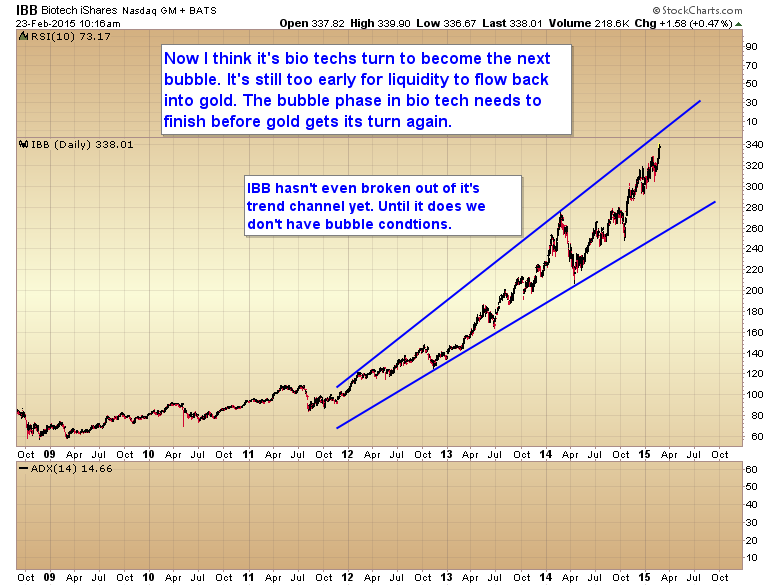
Biotech looks very bubble-ish to me. IBB has gone from 100 to 340 in 3 years.
It needs to breakout of the trend channel and deliver 100% or more in a year or less.
Oil did 200% in a year and a half, and over 100% in the last 6 months.
hi gary, you say biotech needs to go up by 100% in one year to anywhere near a top
Gold in 2011 did not go up anywhere near this level but it still entered a bubble?
Cheers
I don’t count gold as a true bubble. Maybe a mini bubble. That was just a powerful C-wave top. The real bubble is still to come IMO.
Where is all this European QE going to go?
Into European stocks? Will Europeans banks use it to buy European stocks? Or will they spread it out to Japan, UK and US markets?
I think non-European markets will benefit from the European Central Bank’s money printing starting in a few weeks.
Gary, isn’t this a parabolic?
https://twitter.com/MebFaber/status/569887558307442689/photo/1
That chart just shows the outperformance. IBB hasn’t even broken out of its trend channel yet.
So, Gary, is it not a bad idea to cut my steep losses in my energy positions and move into IBB? Or wait for the next SM ICL to get on the biotech train?
It’s a bit late to buy IBB now with not much room till it runs into the upper trend channel. It might be better to wait for an ICL.
I’d like to see these on a log scale
How is IBB doing? What do we think? Up down? Buy sell?