As most of you who’ve followed me over the years already know, I’m not really expecting a final three year cycle low in the CRB until later in the year. However… there are a few signs popping up that could be indicating that 3 year cycle low is going to come earlier than expected. And by earlier I mean it may have already occurred.
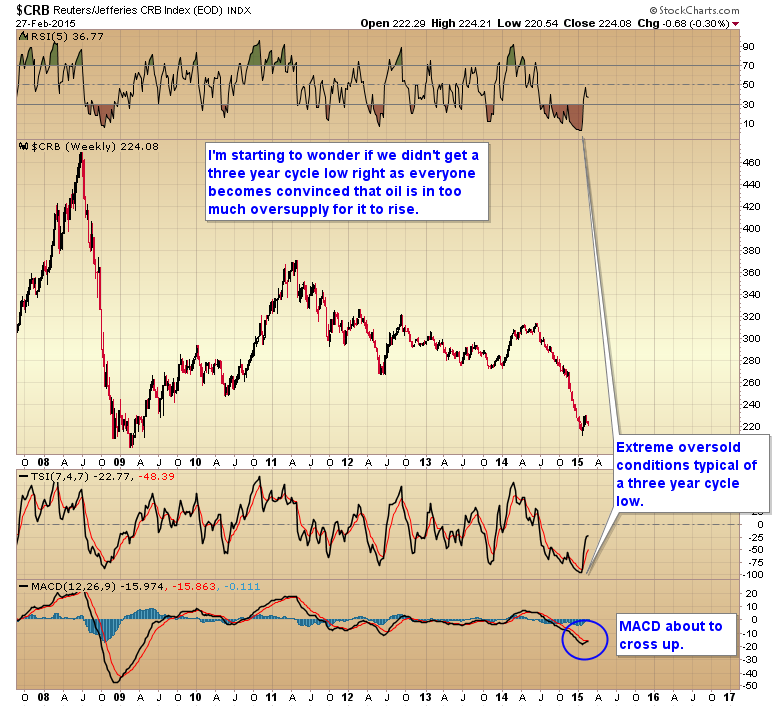
First I want to talk a little bit about oil. I think everyone knows by now that the fundamentals for oil are completely broken, there is simply too much supply, and price will never be able to rise by any significant amount anytime in the near future. I’m starting to see outrageous predictions of $20 oil. However, that is exactly the kind of sentiment I would expect to see at a three year cycle low.
Moving on to some long term charts, you can see that the CRB has reached the kind of oversold levels indicative of a major three year cycle low. By some measures the CRB is more oversold than either of the last two major cyclical bottoms in 2009 & 2012.
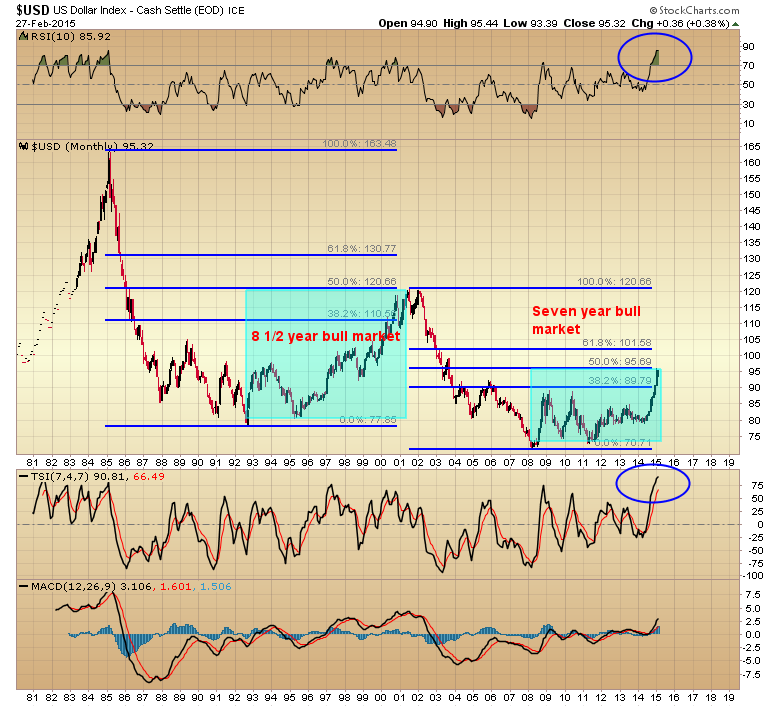
Clearly the main driver forcing commodities lower is that the dollar has been in a seven year bull market. However, seven years is just about a normal duration for a dollar bull, and as you can see in the chart below the dollar has retraced 50% of the previous decline, which is coincidentally the same retracement that the previous bull accomplished prior to a bear market. Note the extreme overbought conditions on the monthly chart. With interest rates at virtually 0, and little incentive to raise them in the near future one has to wonder how much upside is left in this bull.
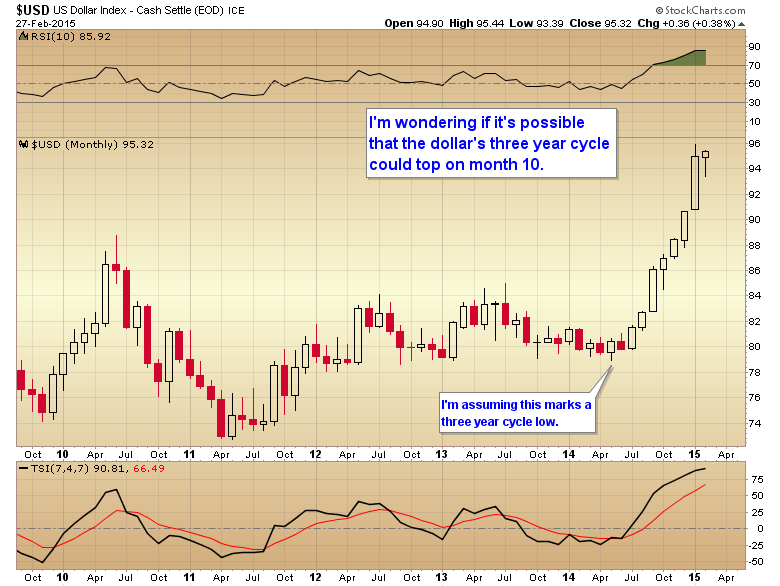
The last thing that anyone is expecting right now would be for the dollars three year cycle to top in a left translated fashion on month 10. I think everyone is expecting the dollar and euro to go to par sometime this year (as am I). I just wonder if it might do the exact opposite and catch everyone on the wrong side of the boat.
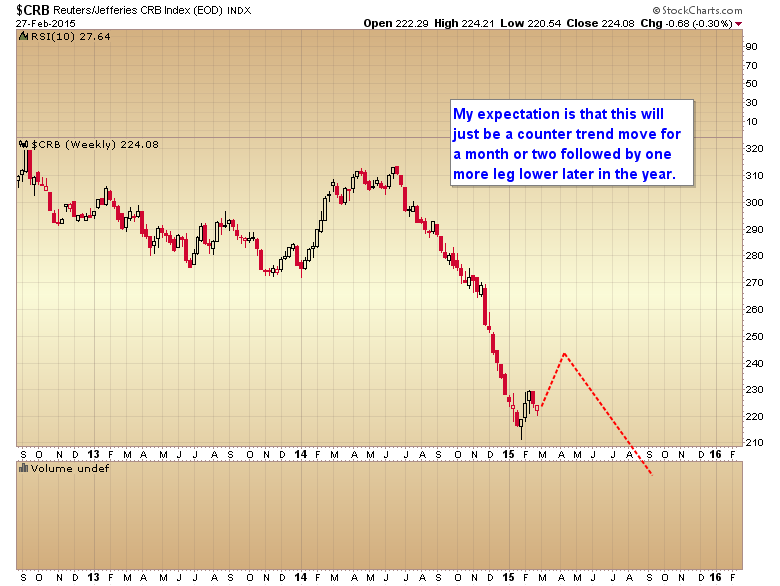
And yes I know, my expectation has been for a counter trend move early in the year followed by one more drop into a three year cycle low in the summer or early fall. And that does still remain the most likely scenario.
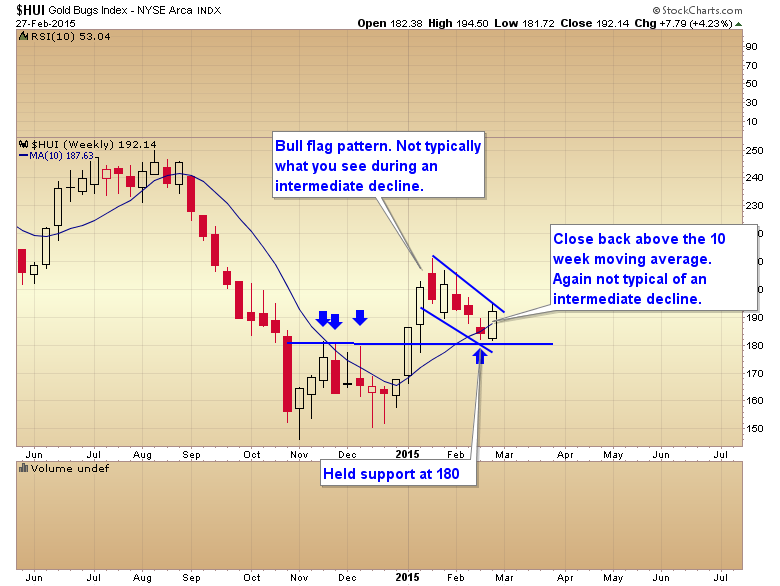
However, the mining stocks (and energy stocks) are not been behaving like they usually do during an intermediate degree decline, and that has me wondering if gold didn’t possibly make a final bottom back in November, and is leading the CRB’s 3 year cycle low by a couple of months just like it did in 2009. As a matter of fact, the weekly chart of the HUI is exhibiting a number of bullish patterns.
Notice how the recent correction has formed as a bull flag instead of the usual close back below the 10 week moving average, and acceleration downward that we typically see during an intermediate degree correction. As a matter of fact the miners tacked on 4% this week and closed back above the 10 week moving average. Several of the majors like Newmont and Barrick Gold have broken out to new highs. That is a bit unusual during an intermediate degree decline. Usually once the mining stocks lose the 10 week moving average it doesn’t get recovered again until after a final intermediate bottom forms. Also notice that the recent low held support at 180.
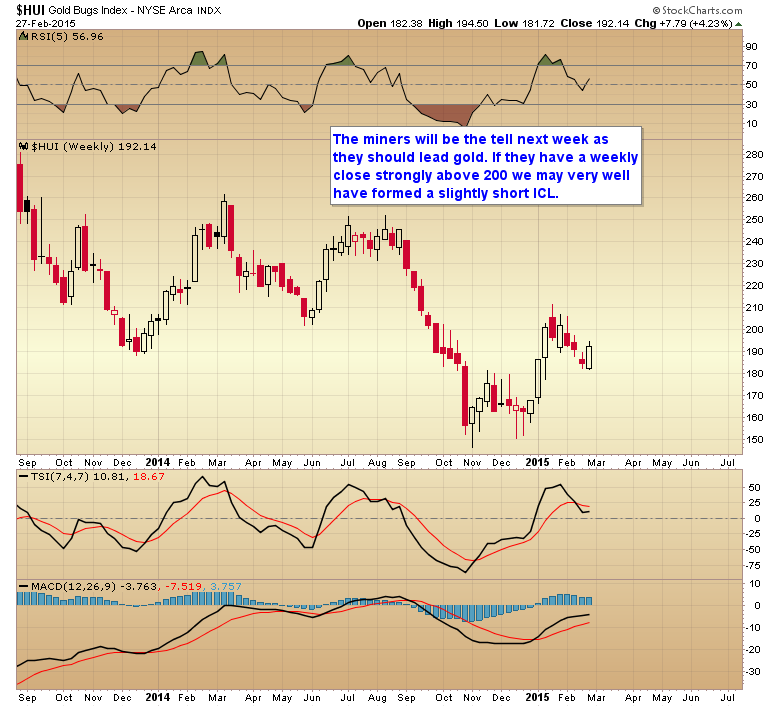
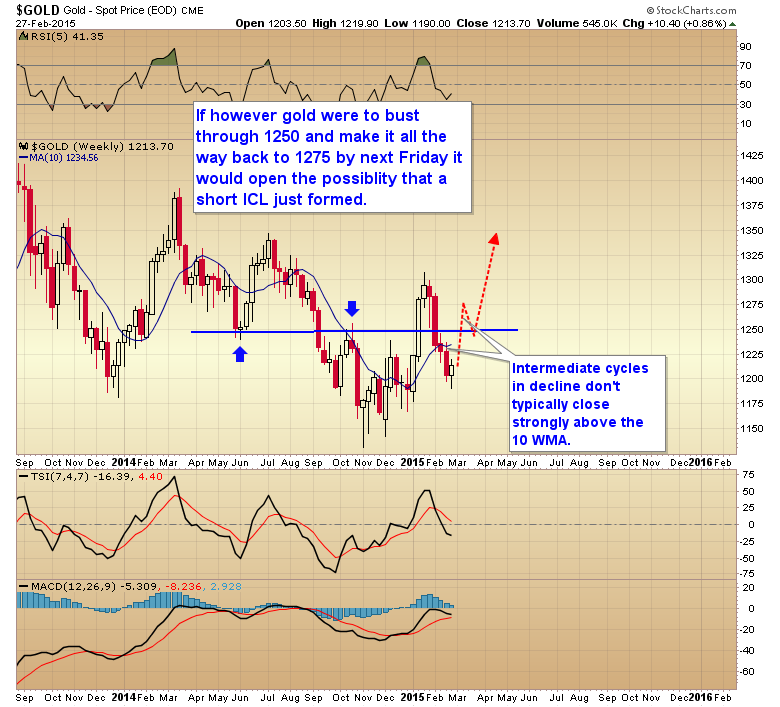
I think next week is going to go a long way towards clearing up whether we are just looking at a weak bounce out of a daily cycle low, to be followed by another leg lower, or whether gold may have just printed a slightly shortened intermediate cycle low (I’ll explain in a minute). If the HUI can close strongly above 200 by next Friday, and survive the employment report I’m going to start leaning in favor of the short ICL scenario.
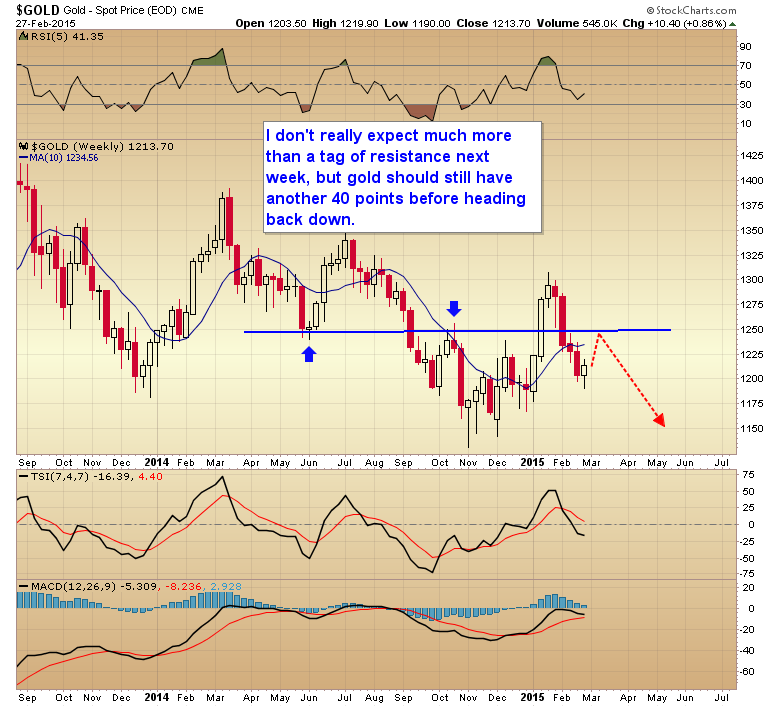
Now let me explain what I’m looking at as it pertains to gold and the possible short ICL. To begin with my preferred scenario is still the bearish one where gold rallies just far enough to break its cycle trend line and then continues down into an ICL in the normal timing band for that event (still 5-6 weeks away). In this scenario resistance in the 1250 ish zone would turn gold back down. That 1250 zone is going to be an important milepost this week. If gold makes it through that level then the short ICL scenario is going to gain a lot of traction.
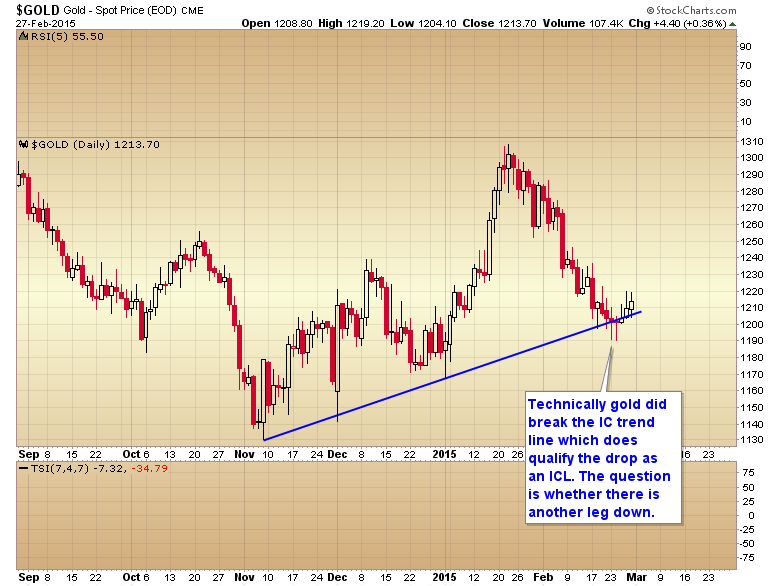
Now for the bullish scenario. As most of you know in order to confirm an ICL an asset has to break its intermediate trend line. Surprisingly gold did that, at least marginally this week. Granted this could mean that the intermediate decline has only just begun, and after a weak bounce gold will continue down into a final ICL in the normal timing band for that event, complete with a bloodbath phase. Or… It could be that gold dipped just far enough to complete the broken trend line requirement, and then formed a shortened intermediate cycle low.
This could turn out to be the case as the dollar starts to move down into its own intermediate cycle low in the weeks ahead. If gold resumes its normal inverse relationship with the dollar then it could be that gold printed a short ICL and the low probability bullish scenario will come to fruition.
So next week I want to see how gold handles resistance at $1250, and how quickly it gets there. If gold were to reach that $1250 level by Tuesday or Wednesday it would increase the odds of breaking through that resistance zone. But even more important I want to see how the miners perform next week. If the miners end the week with another 5 to 7% gain, and survive the employment report, that is indicative of a new intermediate cycle rally beginning, rather than a counter trend bounce in an overall intermediate decline.
So a word of caution, I don’t want to get everyone’s hopes up too much, and definitely do not start buying call options willy-nilly, as the bear scenario is still by far the most likely outcome. Shortened ICL’s are rare, but they do happen from time to time. That being said, the miners are not acting like they have before during intermediate declines and that warrants at least a small bit of cautious optimism. Like I said, a small glimmer of hope for the long suffering gold bulls.
Click here to follow my daily reports next week as it could be a pivotal week for gold.
CRB ? look to China.. Are they building something?.. yes..in Afric
Gary, I am not going to be too thick here and I do enjoy your website, but I told you Gary in early Oct that the low was about to happen in Oct/Nov and that is still valid. However I posted in another forum a couple of days ago.
Seeing a repeat of a head and shoulder pattern indicating A NEW LOW in June.
http://www.tfmetalsreport.com/comment/473849#comment-473849
I do not expect this scenario to play out. The Bear is too exhausted and the Bull is getting stronger by the day. Just notice TPTB efforts to push gold below $1100 in Nov, they failed, followed by a very quick recover. Again and again the bear has lost, lately they tried to push it below $1200 and they failed again. Now the Bull is too strong, watch out for some FIREWORKS in the not so distant future 🙂
BR,
/Solsson
Btw, when do you think the DOW/S&P will roll over, go belly up. I am watching it closely!
I don’t see any comments in Oct. or any other month by you???
Yes I would be interested more in the $SPX analysis. from what I see it looks like we go down Mon/Tue and loose about 30 points.
The market is due for a short term correction, but I’m leaning more towards a tag of 5100 before it starts down into a major intermediate degree correction.
http://stockcharts.com/h-sc/ui?s=$COMPQ&p=D&yr=1&mn=6&dy=0&id=p65612063151&a=396543511&listNum=1
Wow! That is some major correction you see coming later in the Spring Gary.
I think I’ve said this once before.. Gold stocks are in the process of forming a bottom — it’s that simple. This so-called ICL that Gary has been obsessing over is not gonna happen. $20 OIL.. also not gonna happen. If anything, that [my friends] is a ‘bullish’ sign… Word of advice to all of you ‘savvy’ investors out there. Don’t fall for the hype! Start building a position in Commodities, nice and slow. Nice. And slow.
Ps: Not all Gold Stocks are created equal, choose wisely..!
I’m always skeptical of anyone who uses…”not gonna happen” in a sentence. Do you have a crystal ball! What do you know that everyone else doesn’t? Gold stocks could be forming a bottom, or this maybe just another “bull trap”. In my opinion best to hold cash and wait and see. Maybe gold is about to reverse and climb back up to $1800, or maybe it’s been affected by deflationary pressures and will fall below $1000, and oil to $20. I personally feel the deflation is not over by any means, just my opinion, hang on i’ll just climb into my time machine, and let you know later.
Can you get me the lotto numbers whilst you are there Bob? Thanks 😉
all about usd
If stocks keep rising along with the dollar then the bearish scenario is going to play out and the glimmer will fade…
Hi Gary,
5132 was an intra day all time high….
…the closing all time high is 5048.62 March 10, 2000
The jokes on you. I posted here on Feb 10 that the NAZ was going to 5100 by Apr based on the breakout of AAPL over 120 on announcement of the iWatch. Everyone called me an idiot and not to buy until the next iCL, but the iWatch won.
So, I will give you another one. Tradition has been stood on its head for a couple of years now with weak Jan then strong returns for stocks. This year will be the year when SELL IN MAY actually works. Likely choppy top for a few weeks end of Mar to May then down to Sep-Oct. Watch out for Brexit talks after May UK elections. No price targets but trend lines suggest support at SPX 1950.
Heck I’ve been saying for almost a year that the Naz would hit 5100.
Timing is everything. Last winter you said 5100 by Apr, but in Jan you said ICL down to 4250 then top in May-Jun. Feb I just pointed out that you were right the first time, People that change their minds every week can always point to sometime they were right.
Haha, here I am Gary 5th Oct
Solsson
October 5, 2014 at 8:06 am
I do not concur with your opinion. It will turn around much sooner. I am thinking late October/early November at earliest and late Februari/early March at the latest. During that period it is time to accunulate as many shares as you can in quality precious metal stocks. I am following a chart from a highly skilled technical analyst since June 2013 and he has been spot on so far. Nevertheless it is interesting times.
And it is still VALID 5th Nov pointed out the LOW, and my inspiration was from this chart:
http://www.tfmetalsreport.com/comment/331108#comment-331108
A prediction calculated 15months before the LOW.
http://blog.smartmoneytrackerpremium.com/2014/10/crb-heading-three-year-cycle-low.html#comments
No, we have no time machine.
LOL. Go back and look at my last chart again. I anticipated the bottom perfectly and even pegged the price. If the bear scenario plays out I will even get the second half of the pattern perfect.
I figured out why I couldn’t find your previous comments. You used to post under Stefan instead of Solsson.
Looks like conventional stocks are just going to keep on going higher – and Gary seems especially right about biotechs.
Would love to see a correction here now as a buying opportunity but I just can’t see it – I mean, I can’t see what would cause a dip now. Ukraine seems peaceful. Greece appears to about to be bailed out by the EU. So what could knock the conventional stocks down now?
Is Gary’s parabolic bubble move already underway?
XON has come out with good results tonight and is up 6% after hours. Bio techs seem to be marching onwards and upwards.
Thx for all the good work you are sharing with us 🙂