Strictly Necessary Cookie should be enabled at all times so that we can save your preferences for cookie settings.
If you disable this cookie, we will not be able to save your preferences. This means that every time you visit this website you will need to enable or disable cookies again.
Was really hoping that would allow more downside for an intermediate bottom. As usual, they hijacked it. sigh….
I am talking about the stock market.
Yep, was hoping for a drop today also and into next week. Looks like we are going to get the opposite – onwards and upwards today and into next week.
Again, this is a BULL. It may never let you in. It may just go parabolic before any significant correction. It is a BULL. Pure and simple. Buy or cry.
http://www.bloomberg.com/news/videos/2015-05-08/bill-gross-central-banks-are-gaming-asset-prices?cmpid=yhoo
Bill-gross-central-banks-are-gaming-asset-prices
It’s good to hear Bill say this, but it does not matter. It’s still a BULL and can go on for a while.
This bull has been a nightmare for some specs and a dream for some investors.
This is a job report that the market loves and the Fed hates.
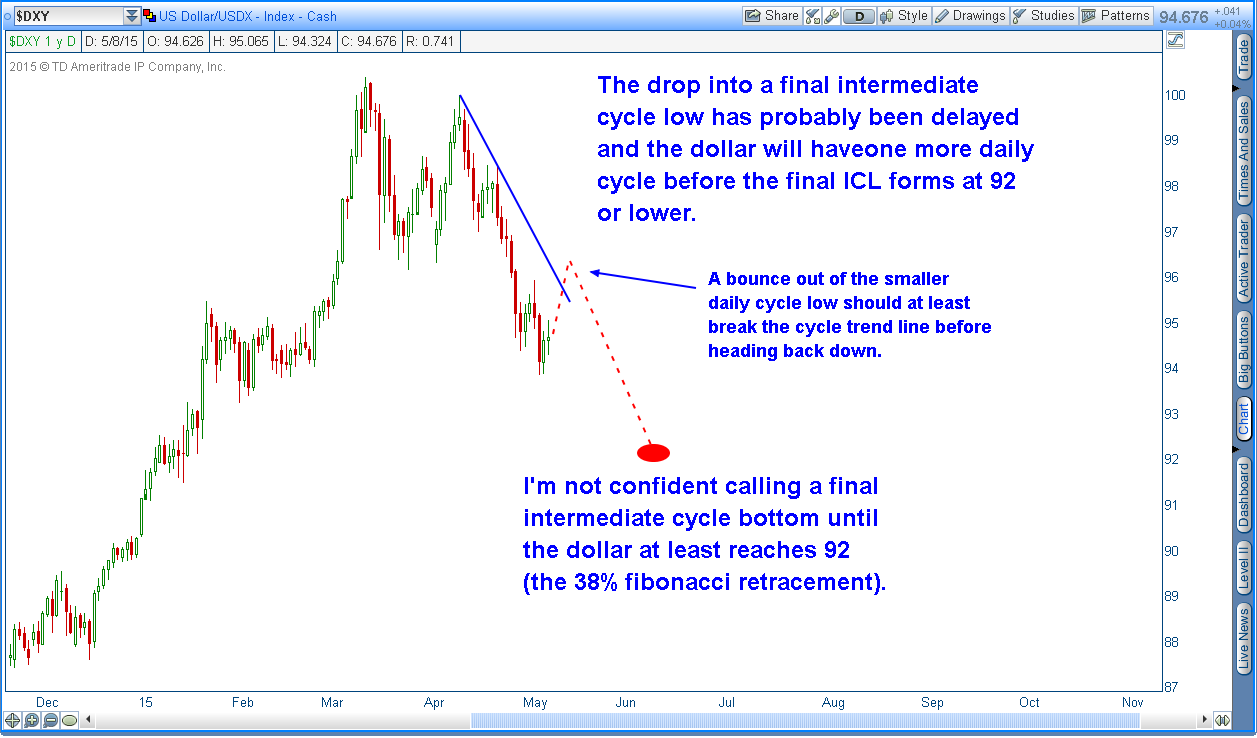
I think the middle comment on Gary’s chart is correct – we get a bounce up in UUP, then back down. I say this because I see positive divergence on the 1 hr chart of UUP, so the bounce up looks like it’s imminent.
“A bounce out of the smaller daily cycle low should at least break the cycle trend line before heading back down.”
A correction to my comment … while I do see an up here, I don’t know if the following down will go as low as Gary’s cycles are saying. The daily chart of UUP looks like this correction is pretty mature, and so if we go up then down, making a higher low on the down part, that could be the bottom in UUP, and we’d just go higher. Back to the bull.
Cycles don’t actually imply targets. I’m targeting 92 simply because that would be a 38% Fibonacci retracement of the rally over the last year.
Interesting times for S&P 500, so far we’ve tested 2116 6times already without breaking it. I’d say that the overhead resistance for S&P500 is a little bit too strong. If this bull is about to continue for some time we need to break it in May/early June otherwise the alarmbells goes off, signals for a change of trend imho.
If you adjust the S&P chart with cpi and qe long term, you will actually see that the 2120 has not been broken for 9 decades.