Strictly Necessary Cookie should be enabled at all times so that we can save your preferences for cookie settings.
If you disable this cookie, we will not be able to save your preferences. This means that every time you visit this website you will need to enable or disable cookies again.
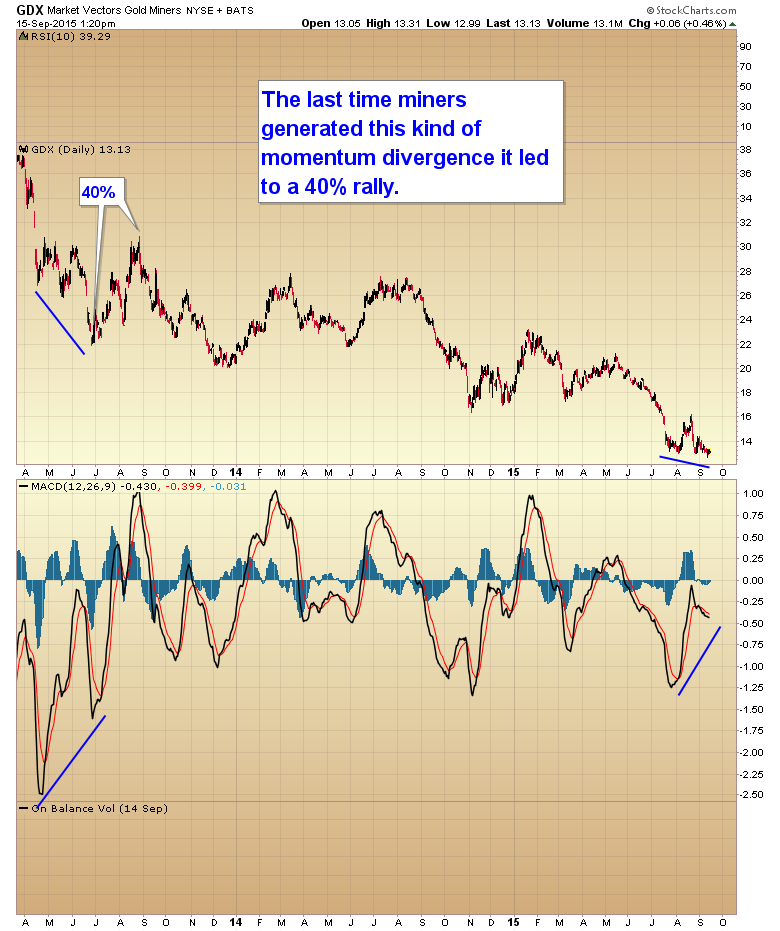
Today looks more like April of 2014
GDX = lower highs lower lows …
Low prices cure low prices! So go commodity prices.
hahaha Rick Rule quote
Thanks Gary – I knew about the Daily divergences, but hadn’t noticed the Weekly yet.
FYI the Weekly RSI(14) is also divergent.
The divergence you are pointing out looks more similar to the first two points before the more major move down in the example on the left. Regardless, any move lower from here should be bought with both hands.
Thanks for pointing it out, however COT price chart compare between the now and then (60k net short, 42% bullish) points to +35% move in GDXJ in coming weeks from here. We shall see.
I don’t know guys for the life of me I can’t see it therefore it doesn’t excite me at all: http://stockcharts.com/freecharts/gallery.html?s=%24gold
I just see a continued downtrend on ALL counts, am I missing something here?
At every bottom it always looks like the trend will continue down. That’s why 95% of traders never catch these bottoms.
Gary u also see a lot of trolls at bottom and at tops moon callers so the more the trolls and moon callers the more one can conclude we’re there or very close. I was bearish too if you recall month ago but i saw that first cycle rocket and i was like wow….this may be it. Then they stopped it to reload themselves and now we’re waiting for something. We soon will know what that is. It’s spring that about to be released.
Commodities, signs of bottoming is approaching? You be the judge!
https://www.linkedin.com/pulse/commodities-wind-change-william-yii?published=u