Strictly Necessary Cookie should be enabled at all times so that we can save your preferences for cookie settings.
If you disable this cookie, we will not be able to save your preferences. This means that every time you visit this website you will need to enable or disable cookies again.
The bursting of the biotech bubble has begun.
http://www.seeitmarket.com/when-market-bubbles-burst-biotech-sector-feels-the-pain-14806/2/
I suspect there will be a real bubble after we get past the 7 YCL. IBB didn’t even complete a real parabola. For that to happen the asset needs to rally at least 100-200% in a year or less and stretch at least 60-100% above the 200 DMA. At the top IBB was barely 21% above the 200 DMA. A strong rally for sure but not even close to a real bubble/ parabola.
Yes, you’re right. It was only up 400% in 4 years.
Bud, actually 325% over 4 yrs, now at 211% after this correction. But I suspect it’s more the things Gary said that lead him to suggest that the bubble is still ahead.
But what I really want to say is in response to your earlier post on GDX’s monthly chart, that it’s not making higher lows yet. True. But I’m sure you are aware that $GOLD has made a clear higher low on their daily charts. This is how a bottom is formed as you know – the daily happens way before visible on the weekly, let alone the monthly. And w/cycles, one’s confidence only increases, esp. w/the longer term cycles that Gary is using. We’ll see. Man, it’s been 4 yrs since the top, so I sure hope we’re going to trend higher now.
$83 in Aug 2011 to $400 in July 2015 is 381%
Close enough.
Definitely a respectable rally, but not a true bubble yet, That’s still ahead once we come out the backside of the 7 YCL.
This ain’t the bubble burst , trust me. Dow is going to 31,000 within 2-3 years or less.
Hi Gary,
I am curious what you think about how the 7YCL fits in with the 35yr cycle in the stock market which is clearly evident when the S&P500 is normalized to US GDP. The chart seems to suggest that the 35yr cycle-low is coming with the next few years.
http://static.cdn-seekingalpha.com/uploads/2015/3/22/37235656-1427058407545742-Chris-Rutherglen_origin.png
Thanks in advance!
Chris
I skeptical about these really long cycles.
Biotech…..
Biotech…
http://bullishbearish.mysupersite.it/
Today may be the day Crude starts to march to her 200MA/40WA thus surprising shorts. Divergence taking shape IMO.
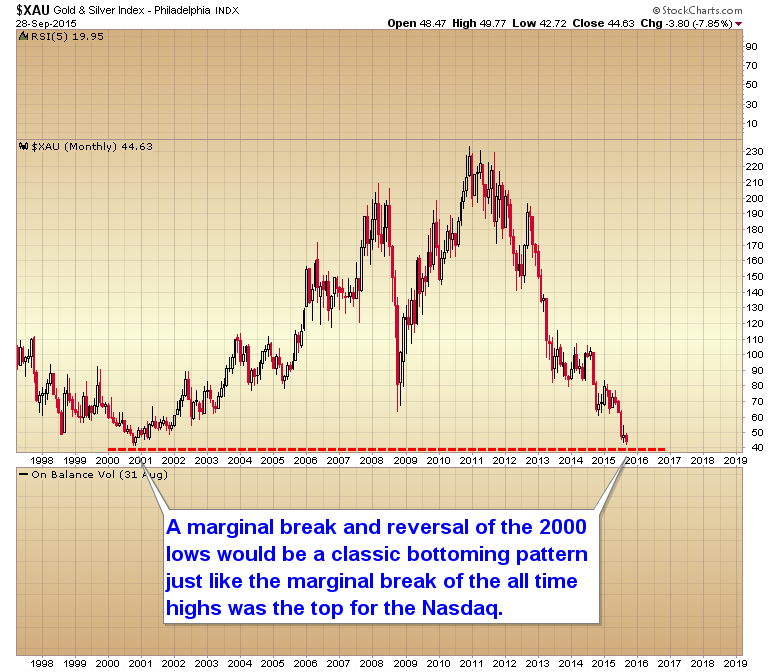
Retest gold $1120 to follow suit?
If we can clear $45 on a closing basis. I think this is it!
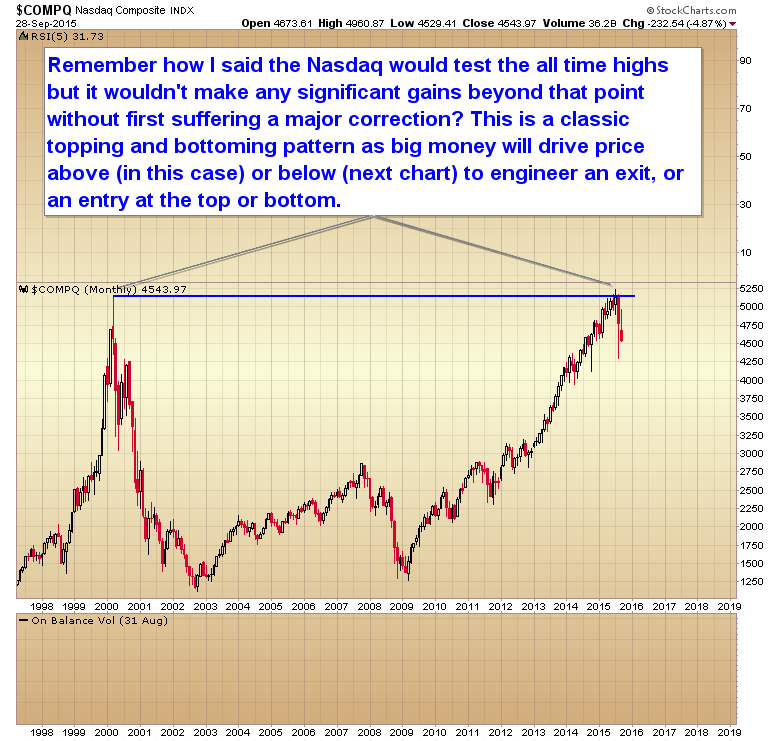
Why do you always use the Nasdaq dot com bubble as a benchmark for everything? That was a once in a generation bubble. With junk bond yields exploding, high beta stocks crashing and TLT rising, the threat is deflation, period.
When are you going to finally throw in the towel on this miners call? Short SPY is still the trade, there is plenty of meat left on that bone. Forget bottom calling in commodities.
Because the big money isn’t in trying to time the bottom in stocks on the short side. At most there might be 10-15% left in that trade. The big money is in getting in at the bottom of a bear market. And the bigger the bear the bigger the bull will be that follows. Once we turn the corner one can make 15% in one or two days in miners, and the upside will be measured in hundreds of percent.
How cute another one who thinks this rise in the stock market can continue forever lol…
Sure, miners will make a great long term investment, but wait for 50-75 on the HUI. They are risk assets that will get crushed in a market plunge, period.
Lots of retail bullish on this general market bounce today. And supposedly Armstrong is bullish too now. XBI cracking, IBB fading, XLE fading, I smell another sharp downleg soon.
Here is the landscape for those who’ve been trying to call the end of the bear market in gold for the past two years: http://stockcharts.com/h-sc/ui?s=GDX&p=D&yr=3&mn=0&dy=0&id=p48772157897
Like I said to Gary years ago, there is nothing happening there. Not a single thing.
The experts says that Gold will Not turn around until we got a pop up in real interest rates, and that is a couple of years left. Bonds and rates must run out of steam before a turnaround in Gold.
We would get a couple of bearmarket rallys in the mean time though, just saying 😛 to sum it up do not expect gold to turn around until late 2018/early 2019.
real interest rates?do you have chart
http://stockcharts.com/freecharts/gallery.html?%24USD
http://blog.smartmoneytrackerpremium.com/2015/09/charts-of-the-day-18.html
Even smart money gets it wrong.
Carl Icahn entire 100,000,000 share position in FCX is under water.
Obviously that was going to happen.
They(PPT) are manipulating the Dow UP; but they cannot do same as well as they do with the Dow when it comes to NASDAQ.
Bears must BREAK the BACK OF Dow 16,000 if we are to see SPX 1600-1700 anytime soon.
By Breaking the Back of Dow 16,000, I mean this:
A DECISIVE CLOSE under Dow 16,000 by a 100-300 point margin on a WEEKLY BASIS.
Dow should hit 20,000
I concur. Once this small blip is through in October, we shall head higher to 18k to end the year positive.
Both the Euro and Yen are amidst a break to the upside. I assume commodities will benefit hence the calm before the storm.
This is not the year of a big crash/ correction