Strictly Necessary Cookie should be enabled at all times so that we can save your preferences for cookie settings.
If you disable this cookie, we will not be able to save your preferences. This means that every time you visit this website you will need to enable or disable cookies again.
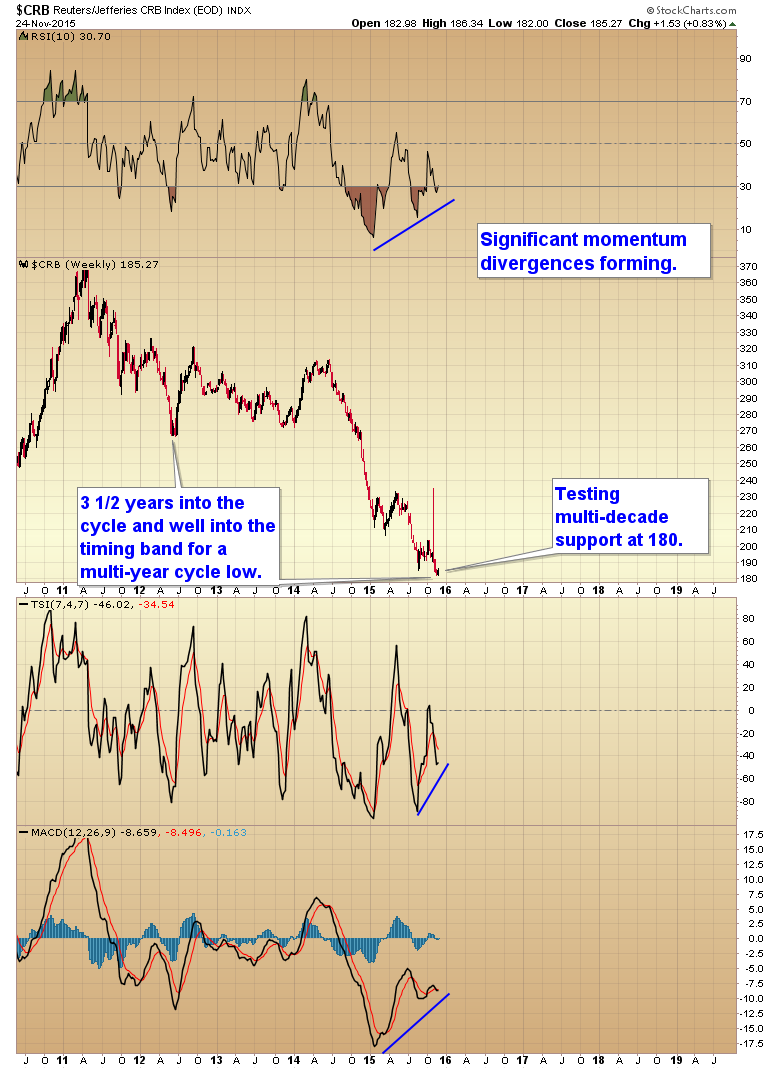
What is that huge spike in the CRB at the start of November?
A false data point in stock charts.
Sentiment on gold at 14% bulls this week. Among the lowest readings of the last 4 decades. Sentiment in the CRB at 29% bulls. Also among the lowest levels in the last two decades. Oil; 20% bulls at the Aug low.
COT’s at extreme bullish levels for virtually all commodities.
This is a contrarians dream….
…and it’s occurring right in the timing band for the 3 year cycle low.
More evidence for the Bulls: A ‘Falling Wedge’ pattern is taking shape on Gold’s Daily Chart also indicative of a potential bounce up 🙂
Gary, to reply to your reply in your prior post, I am convinced gold put its DCL on day 33 last Wednesday.
Cycles of assets in bubble as USX now or in selling climax (as gold now due to USD) usually hide their critical points.
This is now the case with gold which is on day 5 and which put its DCH on day 3, on Friday –> it still has a long way to go down in terms of time (an extra minimum 10 sessions in case this daily cycle will have proven shortened.
…besides, a standalone analysis of gold is irrelevant (bullish COT and technical do not value a dime) as long as the greenback is IN PROVEN BUBBLE PHASE.
YES IT IS A BUBBLE. DOLLAR DOES NOT WORTH AS MUCH AS IT IS TRADING LIKE NOW.
POINT OF BALANCE WITH EURO IS 1.20.
TAKE ITALY FOR EXAMPLE: WE HAVE PRIMARY SURPLUS OF 2% OF GDP AT LEAST, OUR DEFICIT IS JUST 2.4 OF GDP, OUR COMMERCIAL ACCOUNT IS POSITIVE FOR A 4% OF GDP.
IF EUROPE IS SHITTY, UNITED STATES IS NOT BETTER
YOU HAVE FACEBOOK AMAZON, A RUNNING DEFICIT AND ISIS.
SO FUCK OFF TO DRAGHI THAT IS FUELING THIS SHORT SPECULATION AGAINST THE EURO AND ALL THIS PRO-DOLLAR PROPAGANDA
Alex — Maybe you should leave the ‘cyclical’ count to the person who runs this blog and knows what he’s talking about.. just sayin’
Alex,
Gold may have put in a DCL last week but it still hasn’t rallied far enough to confirm it yet. It must close above the 10 DMA, and at least tag the upper Bollinger band. It should also break the cycle trend line, but that is a mile away so I’m not sure about that one.
So as of right now gold has to be counted as if the DCL is still in front of us unless we get the final confirmations.
So new lows here don’t indicate that a new cycle is rolling over. New lows would indicate the gold cycle is on day 38+.
Hi, Gary!
You’ve been my first teacher on cycles and, based on what Ive learned, indeed Friday didnt seem like a DCH in gold.
But, I personally think that both in USX’ case and especially in gold’s case we have witnessed a clear case of CYCLE INVERSION :
http://stockcharts.com/school/doku.php?id=chart_school:chart_analysis:cycle_lines
quote: “A cycle low may be short or almost non-existent in a strong uptrend. Similarly, markets can fall fast and skip a cycle high during sharp declines.”
That’s what I think at least.
what’s with the reversal in the DXY from 99.30 to 100+?
we will see if it is preserved indeed by the end of the day.
I would have personally preferred to see USX slightly gliding to 99.10 and sitting there until Friday –> that would have been an extremely bullish development (and a cup-with-handle formation).
If today’s breakout is bona fide, then we will have only a cup stretching from the YCH in March.
Hi AlexP & Gary,
I’m tending to agree with Alex, that gold & GDX are on day 5 of a new daily cycle, which could bottom on day 28 & 29, respectively.
But hey — why argue: We are either gonna get a weekly swing low, or lower lows before the markets turn — which they seem to like to do around 12-1 p.m. on Dec 31…
See my comment above. Gold has not rallied enough to confirm a DCL yet.
Alex — not sure if you read my comment from yesterday — one scenario in which this new gold daily cycle has already peaked is the running triangle (in gold), to be followed by five waves down before a reversal — perhaps multi-year.
In the running triangle scenario, 1064 would be the famous “undercut low”
Also, thanks for your constant reminder of the correlation between DXY and gold. I always looked at the dollar — but recently I’m paying closer attention to it. It’s interesting to start with UDN (inverse of UUP) chart. Then overlay GLD — which is roughly slight leverage over the dollar. Then lay UGL on top of that. GDX on top of that. NUGT on top of that. This are a few things that will make you go hmmm… 🙂
Hi, Z! I agree with you that the current DC of gold peaked [on Friday].
If you mention “waves” then maybe you are harking back to Elliot Theory which I am not accustomed with; for some reason it did not resonate with me when I started reading about it, so that I left it out altogether.
So … sorry, Z, I cannot issue an opinion on the latter part of your argument.
Alex,
My favorite subjects were geometry, trig, and French. At uni, I grew fond of probabilities while studying Economics. When I was 12 years old, I recall a photograph on the cover of the local small town newspaper in which two men were looking at that same photo of themselves on the same cover of the same newspaper — one was pointing out the photo to the other — ad infinitessimum — how on earth did they create that photo? And where does it end? The world is mysterious and unfathomable. It was love at first sight for me & the fractals. The universe in a grain of sand kinda thing. All past, present, and future occurring in a single moment. If you don’t feel these things, then fractals will be nothing more than a concept, and patterns will not resonate.
I gather your approach is more akin to classical TA. Still, if you want to take the progression I suggested above: UDN/UUP -> GLD -> GDX -> NUGT/DUST, I believe it’s either necessary, or highly helpful to learn the patterns. That takes about 10,000 hours — if you hate geometry, that will be torture. If you like the geometry, then I guess it’s a commitment to putting in the 10,000 hours.
I did thousands of proofs & pattern constructions in geometry & trig as a teenager.
I downloaded Prechter’s Elliott Wave videos on April 17, 2013. Better late than never 🙂
Like you, I also notice the populist emotional tendency you describe as gregarious. I replace that with Chaplin’s Gold Rush, which I feel captures the volatility of the miners perfectly. One minute you’re hanging on a cliff on the verge of plunging into an abyss, the next, you’re a zillionaire who got the girl & are now riding first class on an ocean liner to San Francisco.
Similarly, the move from UDN to NUGT and UUP to DUST is about one order of magnitude.
Another thing you’ve made me aware of is the need for me to take more trades. Cis, Japan’s #1 day trader, claims a 60% success rate historically. I recently met a forex trader who trades coin flips — he’s good at identifying when a move will occur, but 50-50 on which direction it will go. He uses tight stops to minimize the losses on his wrong trades, but holds his winners longer, giving him a significant net gain. When I asked him what he would consider to be an ideal trade setup, he immediately responded 60%. I am beginning to realize that to win, you’ve got to be in the game.
I also feel I have a low trading frequency (most likely much lower than yours) but maybe that’s so because by character I am a fearful and mostly coward person (if a house is on fire, I cannot imagine myself ever going in to save anyone screaming unless a very close one is in there, so that other feelings can override my innate yellow-feather) and maybe I will never be able to move forward in that frequency respect –> thus I am stuck with high-probability trades only (such as now long USD and short gold 🙂 )
I’ve loved geometry myself too 🙂 but not trigonometry: the second 4-grade I had ever taken (in Romanian educational system grades are from 1 to 10 and 5 is passing mark) was in my junior high-school year on trigonometric circle 🙂
I don’t know, Z, if I’ll ever go into high-volatility trades … I am too coward for that … any security with an ATR% above 6% almost makes me tremble while GDX’ 15% …. I can barely think of it…my brain refuses
Today could be the day gold visits $1050? If Paris attack, russia attack cant bring it up, its going down?
Interestieng piece from Bob Moriarty,today is November 25th 2015,a full moon.
Gold could go either bounce strongly from here on or break lower to a new low:
http://www.321gold.com/editorials/moriarty/moriarty112515.html
Ha, now that is a reach. But probably will come true. I am going to add that to my probability section.
some anecdotal evidence of full moon theory:
last full moon was on October 27, gold peaked at 1180 at October 28 and then crashed…Just sayin’
🙂
If we are going to use full moons as indicators then I don’t feel too bad giving my prediction))
I am looking for $dxy to reach 100.50 and then in Elliott waves the dollar should begin a 4th wave correction and thereby we should see the gold bounce we have all been looking for.
Last check today $dxy high was 100.17 so it could reach it today but in either event it’s very very close.
Divergences can still lead to more divergences on the way down. I think we will see one final “mother of all flushes” to scare everyone out of this sector for life, before we see hyperinflation occur. 🙂
yeah so jay herman alexp ted and everyone else will be able to buy supercheap…
what do you think AlexP, USD topping or breaking out here?
Retail traders think emotionally. They look for patterns to repeat. Unfortunately they rarely do in this business. Because the dollar rallied very strongly last year, emotional retail traders are looking for it to repeat that move once a breakout occurs.
The odds are heavily against that happening. The dollar is too stretched above the long term mean to have any chance of repeating what happened last year. Any breakout at this point will almost certainly be met with smart money selling and then back down into the consolidation zone it will go. To have any chance of rallying to 110 or 120 the dollar will need to trade sideways for at least another 1-2 years to allow the mean to catch up to price.
I dont know Herman. I would personally prefer seeing USX averting its growth from here and to see it sliding to 99.15 or so tomorrow/friday.
such an action would not only put a handle to the cup but also help shakeout weak bulls and provide a clean slate of relatively cooled daily oscilators –> a good technical board wherefrom USX could safely spring above YCH 100.72 next week.
everything Gary says is 100% accurate from my point of view, except that it is not applicable to the special situation of an asset in bubble such as USX is to be at least until DEC16 on FOMC – this is also my trading interval for my UUP and DZZ plays, not longer
All I know is the SPX is so very bullish.
if it’s so bullish then make new ATH already and blow the last of us bears away. Sick of this chop and blatant Fed manipulation in a collapsing economy with geopolitical tensions exploding.
Preach brother preach.
Hi Gary
I feel dollar’s rally is over. it tried couple of times to get above 100 but just couldn’t keep it. So I am bullish on gold now.
last night, it was a fake move for dollar to get above 100. So all dollar bulls who bought at that level got sucked in. it is pretty clear to see a doji star today on dollar’s daily chart. so the dollar just made top in the intermediate cycle.
please see the link below
http://www.zerohedge.com/news/2015-11-25/we-reduced-our-short-euro-did-goldman-just-hint-draghi-may-do-nothing-next-week
If EU doesn’t do new QE next week, the FED is not able to lift up rate in Dec. Besides, IMF will decide to include Chinese yuan into SDR on Nov. 30. These are bearish for dollar and all bullish for gold.
The dollar does not look stretched to me.
http://tinyurl.com/o2vzc8q
Of course not. But all gold newsletter need something to hold their subs. 🙂
The dollar is more stretched above it’s long term mean than just about any time in the last 20 years. Of course if you use a faster moving average you can make the chart look reasonable. A 10 day moving average doesn’t look stretched at all.
I’ve been more bullish on the stock market lately than gold. Maybe that makes me a stock market newsletter 🙂
Notice how 2016 has been a sideways year to allow the long term average time to catch up to price. We probably won’t get a big breakout in stocks until at least the middle of next year as they probably still need to move sideways a little longer.
Holding crude long (bulliish daily camdle and weekly swing low)!
All readings are bullish, just waiting on CRB weekly swing.
Dec 2nd OPEC meeting looks to be a continued black swan event from Monday.
August 24th bottom may be intact.
Gary,
May as well ask the big question while it’s still timely:
Do you think gold & GDX will make a weekly swing low before the FOMC meeting?
Alex & I think not. I’m not convinced the answer is no, but leaning in that direction. I don’t think we’ll get another weekly swing low until just after the new year — I was not willing to risk money on that forecast at 3:55 p.m. this afternoon, for pretty much the reasons you have stated, but I believe that’s the case.
Also, could you please post a quarterly chart for gold, on semi-log scale, 1913-present?
I know I’ve seen one 2-3 months ago, but can’t seem to find it. I think it would be edifying for everybody!
David Silver
Crude oil is certainly not in a Black Swan event. The daily chart is barely hitting 2.5 standard deviations from the mean — that’s a QUARTERLY EVENT.
A Black Swan event occurs less than once in a BILLION YEARS.
The Black Monday (1987) decline was—and currently remains—the largest one-day percentage decline in the DJIA.
Black Monday was a 36 sigma event, according to Nicholas Nassim Taleb.
A 6 sigma event corresponds to a chance of about two parts per billion. If events are taken to occur daily, this would correspond to an event expected every 1.4 million years.