Strictly Necessary Cookie should be enabled at all times so that we can save your preferences for cookie settings.
If you disable this cookie, we will not be able to save your preferences. This means that every time you visit this website you will need to enable or disable cookies again.
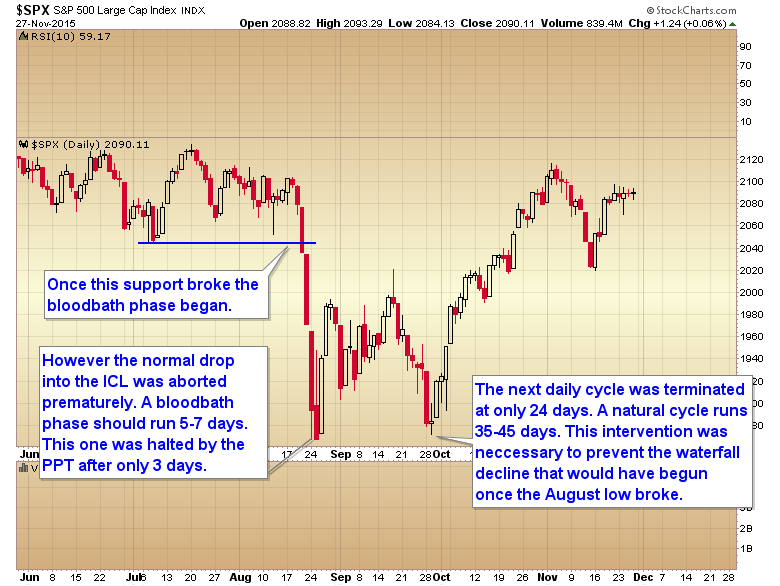
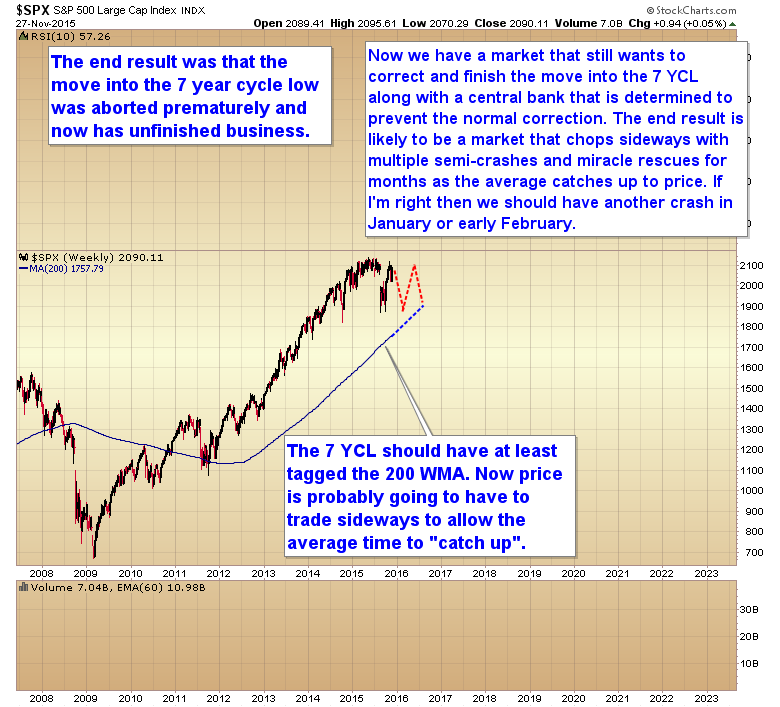
I suspect 2016 is going to be a difficult year for stocks just like last year was. There’s likely to be lots of ups and downs but not much in the way of a sustained trend until the Fed throws in the towel and starts the next offcial QE program. Intermittant interventions can keep the market propped up, but they won’t drive it to big new highs. QE has been the fundamental driver of this bull market since 2009, and before the bubble phase can begin in earnest we’re going to need the next QE program to begin.
Gary, this post is one of the most thoughtful, smart, and concise chart presentation of the “Anatomy of PPT” and how it recently affected the top heavy stock market in the US. Thanks for this, it was exactly what was needed to shed some light on the murkiness behind these “miraculous recoveries” since October as conducted by government intervention.
The way it is going if the Fed hikes 0.25% or less, there may be another PPT staged melt-up through the end of the year; but then afterwards, as you say in Jan. it could have a mini-crash again especially with tax selling.
The thing is the PPT road to push up town is littered with bodies of bears, and shorts.
Hi Alex,
Great to hear from you.
In markets or any statistical distribution of data points, I take any and all story with huge grain of salt — more like, for entertainment purposes. I’m an Economist, you know! Furthermore, I’m a Buddhist, currently in the Buddhaland. Just got back from a nice visit to my favorite temple whose pagoda crumbled during a monster quake about 400 years ago, wrecking any semblance of symmetry forever. I was talking with a monk friend of mine named Siddhartha 🙂 So I’m always in the mood to detach from concept and get back to the task at hand, which is price movement over time 🙂 So when I think dollar-CHF vis à vis DXY, I’m just looking for predictive value. (On the story side, however, I do dream of getting a Swiss bank account one day and burying my treasure in a cave somewhere high in the Alps, then heading off for some relaxation in Locarno).
So why not pull up a chart? I did, alongside DXY and gold, and the first thing I went looking for was September, 2011. And since the chart is new to me, I was wondering if you’d had any insights.
As for your trading preference, if you suddenly found you were able to predict market movements for a high volatility security with reasonable success rates, and execute such that you could minimize losses on the failures while maximizing gains on the successes, would that influence your trading preferences?
At any rate, I’m always trying to improve my predictive capabilities in any way I can. Lately, I’ve noticed that Gary often talks about the 200 week or 200 day SMA. 200 periods is a much larger sample size than I would ever use for trading. But, I thought, Gary seems to put a lot of belief in it — why not pull up that sample size and have a look? So I did — blew my mind! There is one key element missing from Gary’s chart with the 200 week SMA. He talks about stocks (or any market for that matter) being stretched far above or below the mean — so I naturally ask “How far?” — how far needs to be quantified, which I am more than happy to do 😉
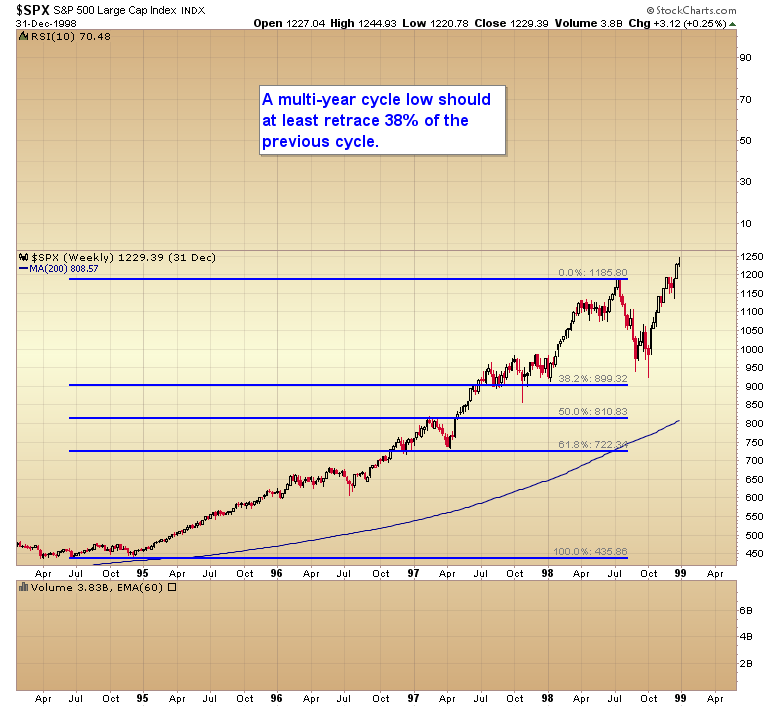
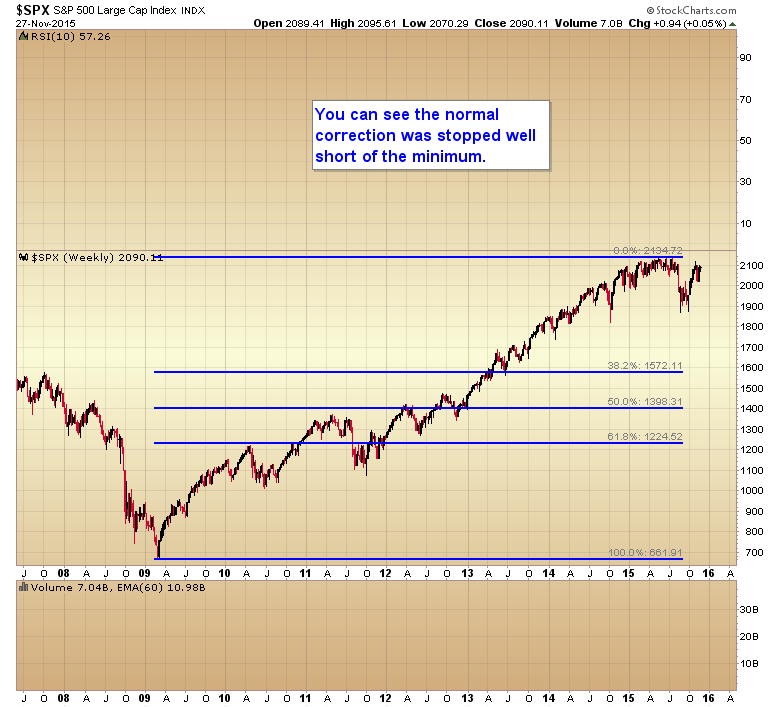
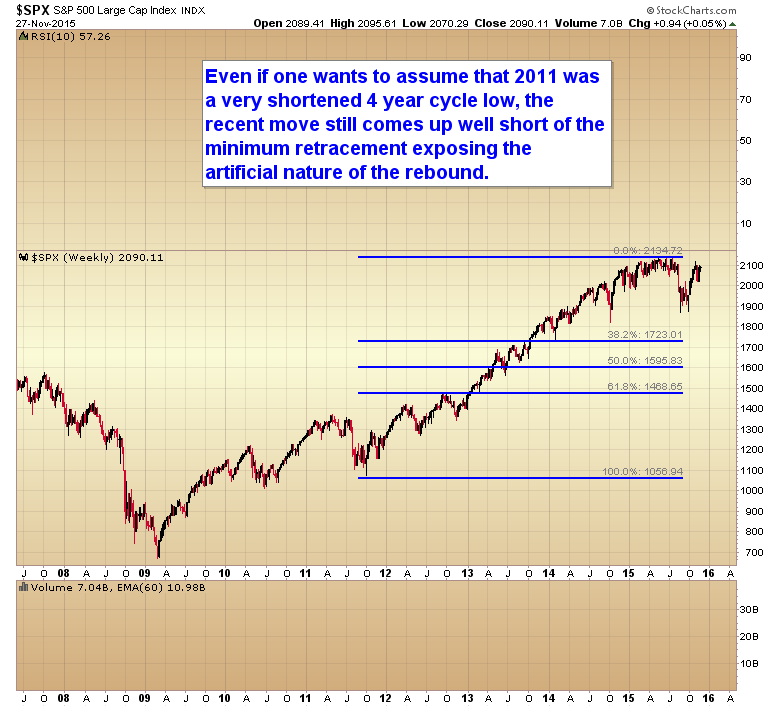
Yes it is hard to determine when a market is too stretched and needs to correct. Extreme can always get more extreme. For that I look at long term cycle timing bands. I knew that this year the stock market was due for a 7 year cycle low. That’s how I called the market crash long before anyone else. Not only was the market stretched but it was due for a regression to the mean event. Add in the Fed trying to artificially prop up the market last year and there could only be one result, the market would have to crash and rip control from the Fed.
Now we are in a similar situation with commodities and gold. They are stretched very far below the mean and in need of a regression event. They are in the timing band for a multi-year bottom and in gold specifically the market is being artificially suppressed. This suggests that when the natural forces finally overwhelm the manipulation it’s going to result in another dislocation similar to what happened with stocks, but in the case of gold it should be a dislocation higher.
Show me where u called a crash and I can show you calling for the next bubble to start. You make so many prediction that you can always go back for a reference. How can you be wrong if you are always change your mind?
Same with gold. Il sure someday gold will bottom and one of your many calls “might” be right.
http://blog.smartmoneytrackerpremium.com/2015/08/crash-potential-over-the-next-3-4-weeks-possible-final-low-in-gold.html
Hello, Hello, Z!
1) on 200wma –> I think Gary is correct employing it.
If you draw the 200Wma of INDU and of NYSE Comp you will see somthing interesting ……. pls do it now and do you see ? 🙂
SPX stopped its fall on AUG24 when INDU and NYSE did.
Pls also draw the 200WMA for SPX, NYSE also in:
– October 1987,
– Oct 1990.
What do you see ?
If you do the same exerceise for 2001 and for 2008 you will see some fight there and prolonged dives as the 200wma fell.
2) on CHF –> as a rule, in order for me to accept an asset it should zero in both fundamentals and technicals. CHF is uninteresting to me fundamentally. The chart may be compelling as you noticed, but a merely technical argument is not enough for me.
I am a hybrid trader who considers an asset for trading/interpretation only when the mix of general market conditions and specific fundamental and technical setups converge. CHF does not make sense to me fundamentally for reasons I expanded last time, therefore it is enough for me to know that it is not for me.
3) You are a budhist, very interesting. So The Middle Way is not only an issue of optimization but a spiritual quest 🙂 This should give you an emotional edge over the crowd, it should ward you off extreme emotional swings and keep inertia at bay while in the markets’ arena.
Very interesting talking to you, Z! 🙂
Have a nice week ahead!
It’s noticeable that you think that common stocks will go up WITH commodities and gold!
Would that imply that the best performing sectors will be PM ,commodities and energy according to you?
Maybe for awhile until stocks start their bubble phase, then the big gains should come in the biotech sector.
Hillary has a bee up her butt about pharma and biotech stocks.
Mr. Savage,
If history exemplifies irrationality, wouldn’t your theory have zero chance of having any credence? Afterall there hasn’t been much rhyme or reason for the most part other than the US market going straight up since March 2009.
Ahh but they haven’t gone straight up. As soon as QE ended last year the markets have been going sideways, followed by a crash.
I am seeing a new crash at the same time next year late Aug/early Sept a 200-300points drop in less than 2weeks?
SPX that is 🙂
That could be entirely possible, especially if the Fed continues to fight the normal corrective forces all year building more and more pressure into the market.
Nothing good ever comes from trying to force markets to do something they aren’t supposed to do.
A good place to bury some money into right now is China. My weapon of choice: CAF — this is a closed-end fund currently trading at a 20% discount to liquidation.. and even though we are pulling back on the Daily chart; the Weekly chart looks very favourable. The fundamentals are also very much in place 🙂
Ps: I rode the June 2014/June 2015 trend and noticed some volatility on the way up. Be warned.
I loaded more SPY OTM March puts on Friday. With China imploding again I doubt they can keep this fraud up much longer.
There’s a lot more to China then meets the eye — and that’s the whole point 😉
It’s a dangerous game trying to fight the Fed’s printing press. It’s probably safer to just wait for the correction whenever it comes, and then try to buy right before the Fed intervenes. That is the strategy I employed this year and it generated a 25% return in a sideways market.
What’s the point of making prediction if you change your mind every few days.
I develop my expectations based on current price action. If the price action changes then I change with it.
We made pretty good money in every portfolio except energy this year.
Only an idiot holds to a bias when it is clearly wrong, or someone who wants to lose money.
Perfect case in point. I was convinced that gold had made a final bottom in July. Everything I was seeing was saying I was correct. Then the ECB started talking about more stimulus reversing the currency trends, and gold printed a reversal on the Oct. FOMC statement. That was the signal that I might be wrong on my call of a final bottom so we took profits on metal positions and got back on the sidelines.
I see dxy heading to 105-107 before a major pause. So those long gold Short stocks gonna , like what’s said in the movie Taken… ” Good Luck”!
Could it be that we are just looking at the paint drying too much? We have a beautiful head and shoulders top that just needs an ever-increasing drop-off to match the great rise of recent years. The top is forming with glacial speed and we fuss and fret over each quiver when we should just appreciate a time when everything is pretty much going as it should. Time to go to the movies?
Gary, Alex,
Thanks for your comments. I am currently looking at INDU, gold, and DXY historical data. I’m a firm believer in focus and depth, rather than looking at a smorgasbord of charts.
Any data sample, whether it’s a market, lab rats, children ages 6-10, octogenarians, male university students at the University of Michigan, or whatever, is analyzed for departures from the mean in the same terms: Standard deviations.
For instance, when I look at DXY long term — weekly chart, sample size 200, since inception, there are three peak maximum departures from the mean (200 SMA) to the upside, and three to the downside. They are the weeks of 2/9/1981, 2/17/1997, and 1/19/2015 to the upside; and 7/2/1973, 1/2/1978, and 7/15/2002 to the downside. These departures are all similar in magnitude. These weeks do not necessarily represent the peak (or trough) level for their respective moves, but they do represent the greatest departures from the mean. These levels are indicative of rare events. I am open to the notion that an even rarer event can occur, as in the gold bull of the 1970s, but if it does, it will not occur in a vacuum, rather it will emerge in ways that may evolve.
In the gold market, departures from the mean are almost 3 full standard deviations higher during the 1970s bull market than any time since it went off the gold standard. As I’ve stated previously, the 1970s gold bull was MUCH stronger than that of the 2000s, both in % gain as I’ve mentioned before, and in departure from the mean, as I’m just now discovering. By contrast, the departures from the mean during the 2000s bull market more resemble the departures from the mean in DXY, in terms of standard deviations. The two bullish impulse waves: 1972-74 and the truly parabolic move ending the week of 1/21/1980, peaked at similar standard deviations from the mean.
Presently, gold is stretched 1.55 standard deviations below the 200 week SMA, which, I believe may signal a bounce, probably minor (daily cycle) degree.
As a side note, one strong reason I may eventually prefer USDCHF to DXY for predictive value is that the former might have predicted the final 11 months to the 2011 peak in gold, whereas the latter certainly did not.
As for INDU, I’ve just begun to look at it, as there’s much more historical data. As you might expect, the first thing I want to take a look at is October, 1987. Though Black Monday may have been a black swan event on the daily chart (I still haven’t looked at that), on the weekly chart, it was nothing but a sharp correction resulting in reversion to the mean, no more. That crash only bottomed about 1% below the 200 week SMA, before bouncing, and then resuming the overarching bullish trend. The October, 1929, crash bottomed 10% below the 200 week SMA, then bounced, but then resumed its move down in 1931. Maximum departure from the mean in November, 1931, was a full standard deviation LESS than those in DXY since inception, and gold during the 2000s, mentioned above.
Again, these are just my first impressions on looking at larger sample sizes for these markets, especially stocks. Even as I’m writing this, some questions are starting to pop into my mind — I’m glancing at the 2002 and 2009 INDU lows — these certainly draw my attention — more than the great depression, not to mention the 1987 crash, in terms of how far the stock market moved below the mean, and whether that bear market is complete or not. So you can see why I believe that broad diversification is destructive to market analysis: One doesn’t allow oneself ample time, energy, and attention to begin asking, and answering all of the relevant questions that emerge. The week of 8/24/2015, for instance? Just a reversion to the mean — Only 0.5% below it — then what?
Time is required to process, internalize, and allow new questions to arise for consideration, while doing things like going for a walk, visiting the Buddhist temple, and sleeping! Looking at a large number of additional charts would only confuse analysis.
Otherwise, I’m looking for work these days, preferably that can be done remotely, if you know of any who needs a hand!
interesting, Z!
gold did move abruptly upwards in the 70s because of FED malfunctioning –> there was a major structural issue left which got corrected only by Volcker who started to tackle money supply directly thus ending USA’s stagflation.
basically gold’s run-up had been caused by excessive inflation which in turn by poor monetary policies.
This empirical data underscores that gold’s bull is nurtured solely by inflationary expectations driven by whatever event (mis-guided FED policy, QEs aimed at killing deflationary expectations).
PS: stocks should go higher this week before resuming their intermediary cycle decline.
For commodities, crude palm oil just put in a weekly hammer as of last Friday. This is the 2nd weekly hammer for this year. The 1st weekly hammer was on Aug 28th. Current weekly hammer was formed last Friday at +11% from the close of Aug 28th’s hammer!
Reckon things are starting to “shape” in commodities’ space…Though i won’t expect every commodity to move in tandem as individual commodities are being affected by their respective fundamental…but, the pull-and-push factor within the commodity sector’s space still play a part…
Would be interesting to keep track of all the individual commodity separately and look for more bullish reversal weekly candle-sticks…
Am I the only man that’s blind, or the rests of you are? Europe has made new weekly higher high. It screams higher. The price action, chart, etc all says so. Yet you guys here still talking about bearishness. ECB is soon going to throw the bazookas at market. Stock index could sniff that. And I repeat again, if Paris, Russia can’t drop market, what does it tell you?
So please, bears pls sell the market. Liquidate your holdings. Please miss tis bull run. Stock market needs bear in order to rally.
To me, it’s plain and simple. As long as right Inverted HS not broken, tis market is bull.
I kind of doubt the market is ready to breakout and zoom higher right now. I kind of think this year may be similar to last year and just churn sideways with multiple Fed interventions to keep the market propped up until they are finally forced into another full scale QE program.
I’ll sell my UUP and DZZ at the opening and I’ll buy some PST – ultrashort 7-10y treasuries etf –> shorting treasuries makes the safest play in Wall street now
Gold & Silver, right on the “edge”…
https://www.linkedin.com/pulse/gold-silver-monthly-charts-edge-william-yii?published=t
for less than one month, US treasuries have commenced a beautiful road: that of tightening the spread between long term and medium term treasuries –> medium term tresuries are falling faster than long term ones so that MT yields are increasing more quickly than T-bonds’ yields.
They will do so until the spread will turn negative one year from now –> an advent of US recession to hit late 2017-early 2018.
Alex, how it would behave when int. rate increase a bit? It would be nice to buy and forget abt it for a couple of years…Thank you.
The market will rally hard in December!