Strictly Necessary Cookie should be enabled at all times so that we can save your preferences for cookie settings.
If you disable this cookie, we will not be able to save your preferences. This means that every time you visit this website you will need to enable or disable cookies again.
Good luck to anyone trying to run down a ? shot headed for the ?. If Friday’s jobs # is worse than expected the “after burners” of this launch are going to kick in as QE4, NIRP, Helecopter Drop or all three get priced into the USD as the USD’s IC trend line breaks and any move above DXY 100 becomes a distant memory! ???
On a day like this one would think gold and the miners would be much higher.
Gold miners still following the dow/ s&p up and down this year so far.
. Spot gold stabile today . the miners should not have sold off like that (2%!?!) if the bottom of gold is in . The bottom in gold is not in .
Agreed
miners’ reaction was caused by USX being rejected by its 50dma.
we have to see in what direction USX decides to trend.
it is this indecision of USX that has prevented me to pyramid my long-gold trade to a full position so far and to tighten my stop at 1107.9.
Most likely USX will play with its 50dma until Friday’s jobs report when … a trend will be decided!
Gary, Too much contradiction! You say ta, sentiment, fundamentals dont matter, then you fill us up with it. I know its your job, but theres gotta be a better way to instill confidence.
If I was trying to trade based on technicals or charts I would have been stopped out when the smart money created the stop run false breakdown.
In the metals sector one has to take everything with a grain of salt and try to anticipate what the cartel is trying to do. Everything else is kind of secondary.
Gary, I too have been doing better trading anticipating the manipulation. Be fearful when others are greedy… If i may ask, how many times in the recent past have you been able to anticipate this same false run to avoid being stopped out? Or is this a new to your arsenal? Thank you for your honesty and integrity.
Hi, Alex
I respectfully disagree with you wholeheartedly . The miners sold off because the dow sold off .
When the miners really take off , first of all it will be repeated 8-10 % up days , also , the miners will not give a damn what the dollar is doing .
S&p broke support just now @1910 . Down until thurs @1850 . The miners to follow the s&p down thru this week
Miners will be just fine…the pause that refreshes.
I agree . If you bought where Gary suggested and you hold , you’ll be quite fine going into 2017 and into 2020 .
Great to hear you back and doing interviews on the Korelin Economics Report, Gary. I have also been following the rounded bottom pattern on gold with growing interest and doing well holding longs on the way up. The pattern on silver is similar but even more interesting in my view. If the silver price rises above the October highs we will have a confirmed megaphone in play and that will be a confirmation that the final bottom was indeed seen for precious metals. Silver often leads when we need insight on the behavior and impending direction of gold. If we get there I will certainly congratulate you for an outstanding call on a precious metals bottom. My upside silver target is currently in the range of 17.25 basis the futures and if we see that then LOOK OUT ABOVE! Keep up the good work, Gary.
Just for a little added clarity on my comment above; There are two kinds of megaphone patterns. Most here are no doubt aware of the much discussed topping megaphone such as the one seen on the long term, multi-year S&P charts. But there is also what is called a “bottom megaphone” that only appears after a long decline on a chart. That one appears at termination points when prices are beginning to rise again. It is a fairly rare pattern and when you see it you really must sit up and pay attention. The HUI also looks to be making such a pattern. The megaphone is know by price rising both above and then falling below prior peaks and valleys. If this one comes to completion then the upside stands to be substantial but we cannot know this for certain until each of the legs has been confirmed. We are getting close on silver. Not close enough to call it with confidence just yet but the outlook is quite tantalizing, so pay attention.
BTDYFI: http://youtu.be/0akBdQa55b4 applies to mining company shares from this point forward now that the secular bull market is back! 😉
coal & oil? beginning of cheap energy?
what makes you think that red. ?
you ever read srsrocco reports ?? EROI….
Be careful folks, miners have been doing just fine when SPY:GDX ratio was heading down. It looks like the ratio is trying to head north again…
http://stockcharts.com/freecharts/gallery.html?Spy%3Agdx
Both ABX and GG had put in daily shooting star the day before while NEM had again hit its previous high in Nov & Dec and stalled…
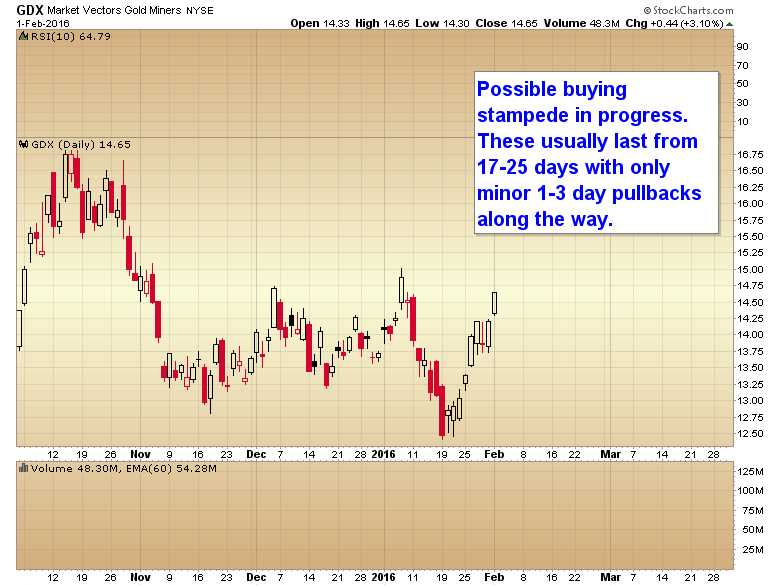
GDX needs to break above $15. Order to sustain its rally…are the odds supportive? You be the judge!
???
And, $gold, looks like it just put in a “harami”!!!
http://stockcharts.com/h-sc/ui?s=%24gold
Daily candles don’t matter, switch to weekly candles and check back on Friday or at the end of the week. 🙂
We shall see ?
How did that 2/2/16 bearish harami candle working out for you this week? ?
And, as we speak now, Gold is still well below the monthly support of $1,176 that it has broken decisively in July 2015. What does this mean if it failed to redeem this territory any time soon? It means to me that the test of the next support is still on the card…and the next support is none other than the $975 – $1,000 region on the monthly chart…
Note that everyone is so familiar with $1,030 figure but on the monthly chart, this is merely an intra-month spike. Therefore, a true testing of this region on monthly chart basis will actually be looking to test the “candle-stick body” at $975 – $1,000 region rather than its “tail” support at $1,030 region..
On this note, on the flip side, it means that DXY will attempt another breakout above 100 level!!!
BLOOMBERG: The FED Wants to Test How Banks Would Handle Negative Rates …
http://www.bloomberg.com/news/articles/2016-02-02/rates-less-than-zero-is-bank-stress-fed-wants-to-test-in-2016
What a difference a day makes as the dollar rolls over.
Gold, oil emerging markets, industrial and material stocks all strong.
Continue to think this will be the new market leadership.