Strictly Necessary Cookie should be enabled at all times so that we can save your preferences for cookie settings.
If you disable this cookie, we will not be able to save your preferences. This means that every time you visit this website you will need to enable or disable cookies again.
As I type silver is trying to breakout above $16.
sideways “correction” in gold and miners? http://www.acting-man.com/?p=43976#more-43976
PM’s spiked because of Brussels bombing.
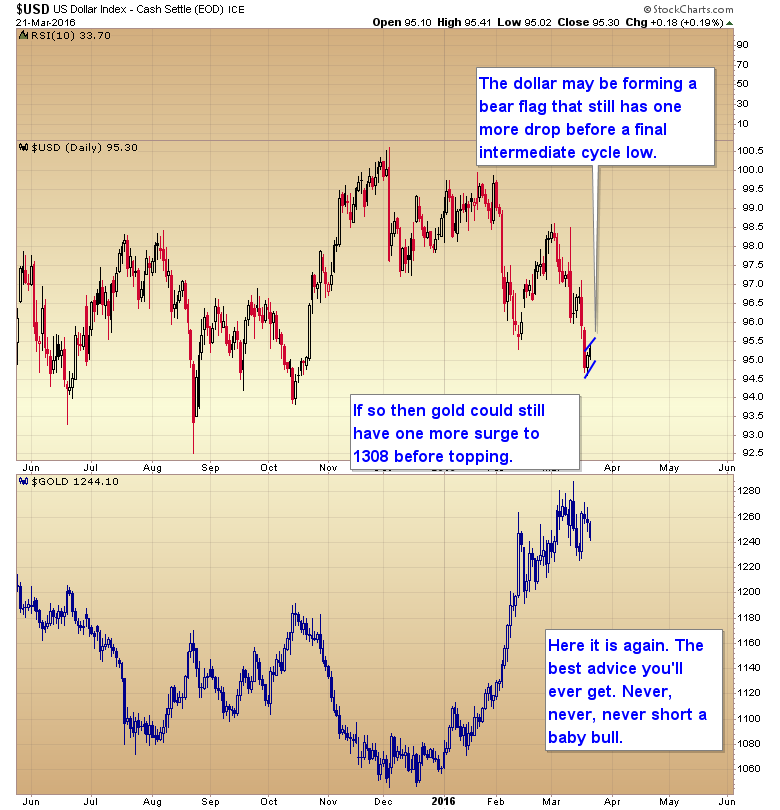
That last dollar chart is a big bull flag starting dec 1 . We’re at the bottom of the flag as of thurs last week .
i wonder if the terror attack may have or can reverse the dollar trade now. Meaning strong dollar weak euro
this is someone that i follow in addition to Gary
http://rightsideofthechart.com/another-biotech-wreck-pending/
You are proving Gary’s point from yesterday’s post, aren’t you? Do you post what Gary says on Rightsideofthechart’s website?
dude – no i don’t
btw – why are you being so hostile… i’m just trying to help other people out.if you’re a nasty kind of person then i have my answer
I apologize if I sounded rude. I meant to be to the point, but I don’t mean to be rude.
Very interesting. Totally the opposite view. I’d love to hear why you think he’s wrong, Gary. (I find myself in agreement with your analysis of biotech, by the way, much to my surprise.)
We all suffer from recency bias. It’s why 99% of traders never catch the big turns. They just expect price to continue in the same direction indefinitely. Perfect case in point: gold.
3 months ago all we heard were calls for 900, 800, 700 or 500 gold. Even though we had a glaringly obvious support zone at 1030 that there was no way price was going below. And as I said many times I was pretty sure price would bottom above that level to catch all the shorts on the wrong side of the market just like the top in 2011 didn’t quite make it to 2000.
Good to read both opinions on the markets. Some say we are at the brink of a 1929 style crash, others say we are on the verge of a bubble phase. I feel whatever direction the markets take the move will be big. It will be very interesting in a years time.
exactly – it’s always good to be prepared for both scenarios – don’t bet the house or your kids tuition money on these sort of speculative trades
Yes, but are any predicting long boring sideways market, let’s say between 2100 and 1800?
I haven’t seen any predicting a long boring sideways market. I’d like to see, if you have any post the links.
Take a look here: http://www.marketwatch.com/story/how-to-invest-as-stocks-get-marooned-2016-03-22
Jacob: I have been Reading Gary for years. and I can tell you that he has hot and cold streaks, like any other analyst. This forum (not Gary) has little tolerance for dissenting opinions. Right now, most are bullish the biotechs. I would like to see a bullish pattern develop before getting on board.
On the contrary, if you had read the comments from a few days ago no one was bullish on Biotech except me. The sentiment levels were at 17% bulls.
I would argue this is how retail traders lose money. They wait until a certain level gets broken and for whatever reason in their mind that means the coast is clear. However what usually happens is that a breakout triggers a profit taking event and price immediately turns lower right after they buy. Then they stop out for a loss. Buy high sell low. It’s the reason retail traders have so much trouble making money.
They expect that a breakout means a trend is starting when usually it just means price is stair stepping up gradually. And the only way to make money in that scenario is to buy low and sell high.
Markets rarely trend. Treating every breakout as a green light that a trend is starting is a sure fire way to go broke.
I am Richard . That range is about right , until late next yr. then the multi year decline starts
Up to 2200 though
OK. Let’s watch the reaction here at 2050. It will be very telling, since we remain in a primary downtrend.
XBI has been moving better than IBB each day, something to remember when I get long.