Let me start off and say the longer one continues to operate under the assumption that we still have free markets the less likely you are to make money, and the more likely it is you will lose money.
Folks we have virtually every central bank in the world printing money (and I think this includes the US). We have negative interest rates in many parts of the world and 0 every place else. I can say without a bit of hesitation that market intervention is now just a fact of life in modern markets. To ignore it is to ignore a very big fundamental piece of the puzzle.
Bernanke theorized several years ago that any determined government could create inflation at will by threatening to, or actually expanding the money supply. He then proved his theory in 2009 during the only brief deflationary period since the Great Depression. QE1 stopped deflation in it’s tracks. Heck for anyone willing to open a history book you know that Roosevelt was able to stop deflation in the 30’s when he effectively doubled the money supply by revaluing the price of gold.
The simple fact is that once all currencies became purely fiat, deflation became a thing of the past. As long as a government has the ability (and will) to print unlimited amounts of currency there is simply no level of debt that can’t be inflated away. The problem has never been deflation, the problem is going to be inflation (currency crisis). That is the end game to this mess that began in 2000 with the popping of the internet bubble.
I’ve maintained for 8 years now that the day the SEC banned short selling in the financials during the heart of the market crisis in 2008 that was the moment we crossed the Rubicon from which there was no coming back. That was the day free markets died in the world. That was the point in history where the protection of the banks became priority #1 and all laws governing fair market practices were set aside so the banks could make money through any means possible, fair or foul.
I’m going to also suggest that in 2011 the Fed discovered a very important tool in the age old war to control the business cycle. In 2011 when QE2 came to an end and the stock market crashed for a second time, the economy started to roll over into recession. When the Fed panicked and started QE3/Operation Twist, it not only reflated the stock market, but they discovered that by propping up stocks they also halted the economic contraction.
As a matter of fact this is the only tool the Fed has to ward off a recession. Trust me, they are going to use it.
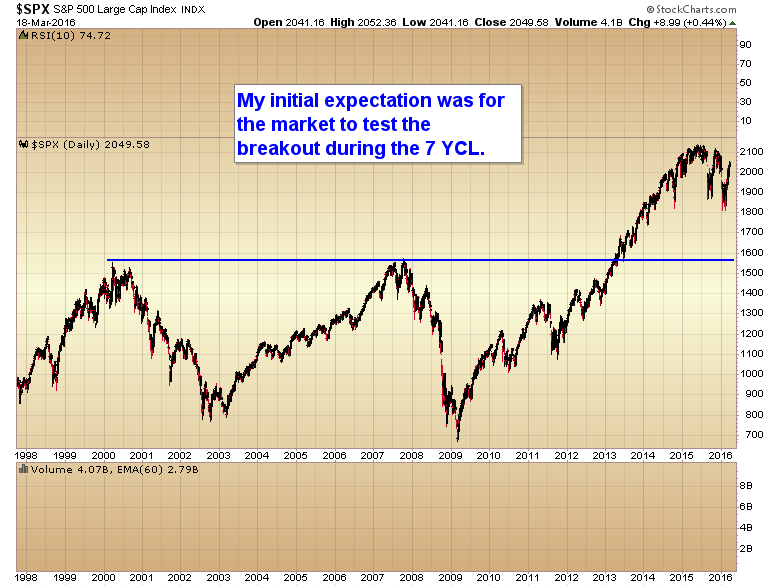
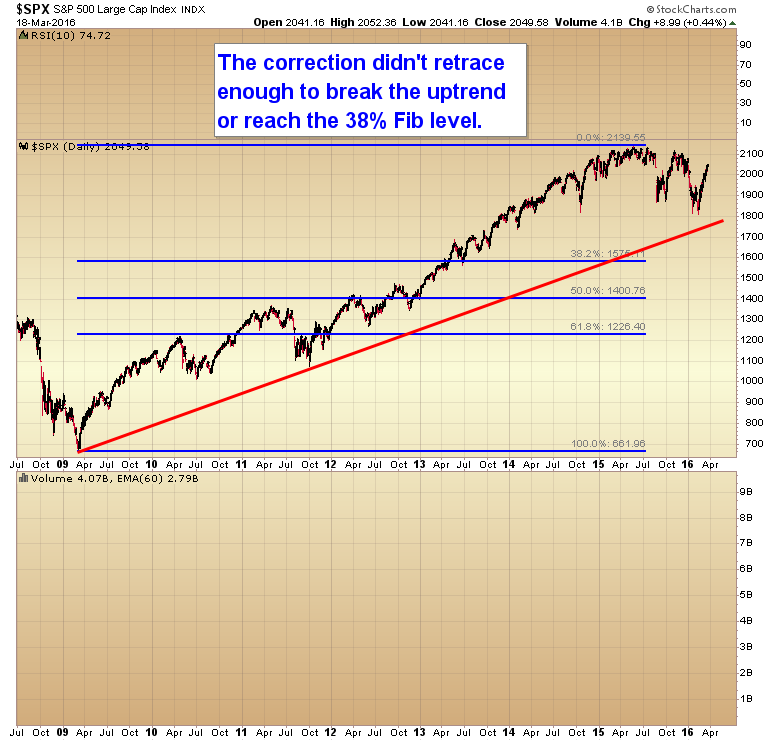
Over the last year I’ve been warning that once the the Nasdaq retested the 2000 highs we would see stocks correct into a very sharp decline, the 7 year cycle low. My initial expectation was for the S&P to retest the breakout above 1550.
However, I’m of the opinion that the establishment (the PPT) has probably succeeded in preventing that from happening with a massive intervention on February 11 through February 14 to prevent the market from breaking through critical support at the 1800 level.
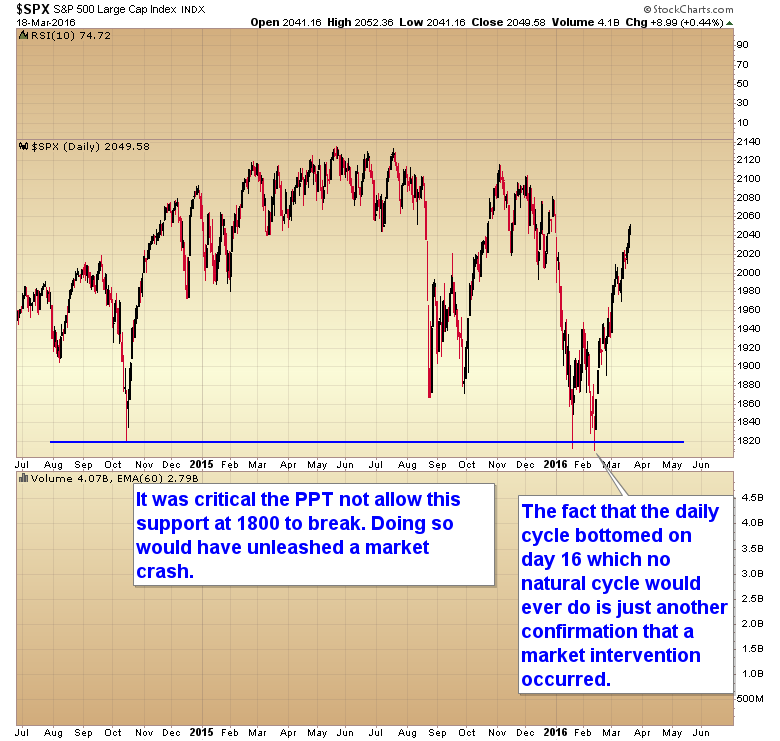
If that level had been breached it would have unleashed a market crash that would have surely taken the market back to my target zone of 1600. And more importantly it probably would have propelled an already weak global economy into recession creating a vicious spiral of lower asset prices, and degrading economic conditions.
So it was absolutely critical that the PPT defend that level or risk allowing the next recession (this time it would have been a depression) to start. I became suspicious at that time that the 7 year cycle low may have been forced to bottom prematurely. Technically it hasn’t done what a 7 YCL should do. Namely it should break the multi-year uptrend line, retrace at least back to the 38% Fibonacci level, and create a market panic (drop 20% or more). As you can see none of those things occurred.
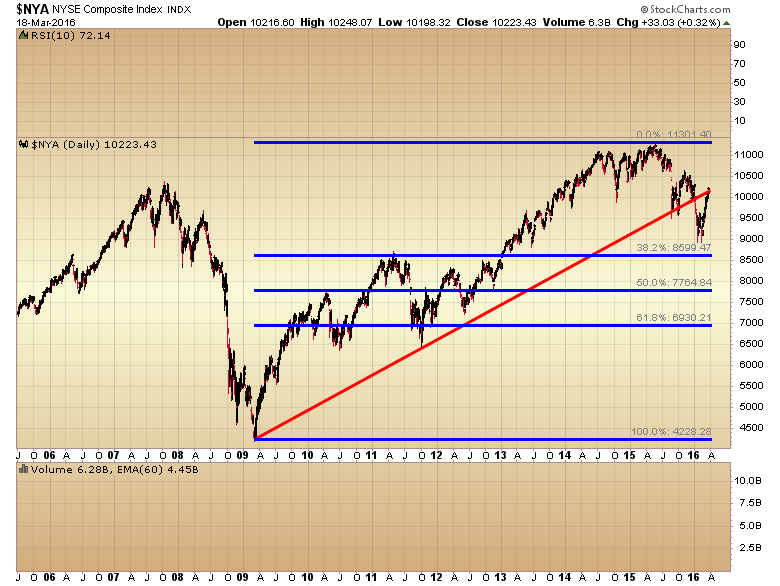
Now one could say that the 7 YCL still isn’t finished, and that may be a possibility, but two things have me doubting that’s the case. First off the 7 year cycle is simply running out of time to finish it’s move. And secondly if we ignore the S&P chart allowing that the S&P can be controlled by the futures market and artificially propped up, and instead look at the chart of the NYSE which has no futures market and is more apt to truly express the real selling pressure occurring, we see an interesting picture. Not only did the NYSE break the multi-year trend line, it also shed 20% during the decline, and came within a whisker of tagging the 38% retracement. So in terms of the NYSE, a market much more difficult to artificially prop up, the conditions necessary to complete a 7 year cycle low were achieved.
So now let me again address this fascination with deflation. Without a doubt deflation is a lot more sexy than inflation. It conjures up images of the 1930’s bread lines and crushing economic conditions. For what ever reason people are attracted to misery. Just look at how many people have to stop and look the next time you see an accident on the highway. We are like moths to a flame when it comes to the dark side. But the reality is deflation has virtually zero chance of occurring unless central banks allow it. All one has to do is look at the last 16 years of history to see what is in store.
In 2000 the Fed remained too easy for too long. It created the tech bubble. The bubble popped. We experienced a mild deflation. The Fed responded by cutting rates to 1%, expanding the money supply and deflation was halted in its tracks. As a matter of fact instead of deflation what we got was another bubble, this time in the real estate markets, followed by a bubble in the commodity markets (especially in oil). When those bubbles popped another short deflationary period began, which Bernanke halted almost immediately with QE1, just like he predicted.
So now we have the deflationists predicting another bear market even worse than the last one, despite the fact that central banks have demonstrated without a shadow of a doubt that they can halt deflation at will. We have a clear intervention to prevent the market from breaking critical support and sending the world into the next recession. I would argue many of the confirmations are occurring to indicate that the 7 YCL is complete. (COT levels, sentiment levels, advance decline line making higher highs, multi-year cycle down trend lines being broken, etc.). And we have clear evidence that aggressive interventions are occurring in all global markets either as profiteering by the banking sector, or as the only tool central banks have to prevent economic conditions from deteriorating into a recession or depression. So I’m going to ask: Is it more likely that this time is different and despite every effort deflation is going to take hold in the world? Or are we going to see the same pattern play out that has been happening for the last 16 years. Namely central banks will keep monetary policy too easy too long, create another series of bubbles, and once those bubbles pop then and only then will we experience another brief deflation… until they crank up the presses again.
So I’m going to say that when you see an analyst trying to convince you that market manipulation isn’t happening you run far and fast in the other direction. In our modern markets market manipulation is the new normal, and failure to acknowledge it, and more importantly anticipate it, is a recipe for losing money. It is the fundamental elephant in the room that many people continue to pretend isn’t there. As a matter of fact once I accepted that we no longer had free markets and began to anticipate when these interventions were most likely to happen my percentage of winning trades improved dramatically. As markets evolve our job is to adapt as quickly to the changing conditions as possible. failure to do so will result in your portfolio becoming extinct.
Like our new Facebook page to stay current on all things Smart Money Tracker