Regression to the mean. There is one universal law in this business and it never never gets broken. Price always regresses to the mean. This one is like death and taxes. It is never violated. And the further price stretches in one direction the harder it moves back once the trend comes to an end.
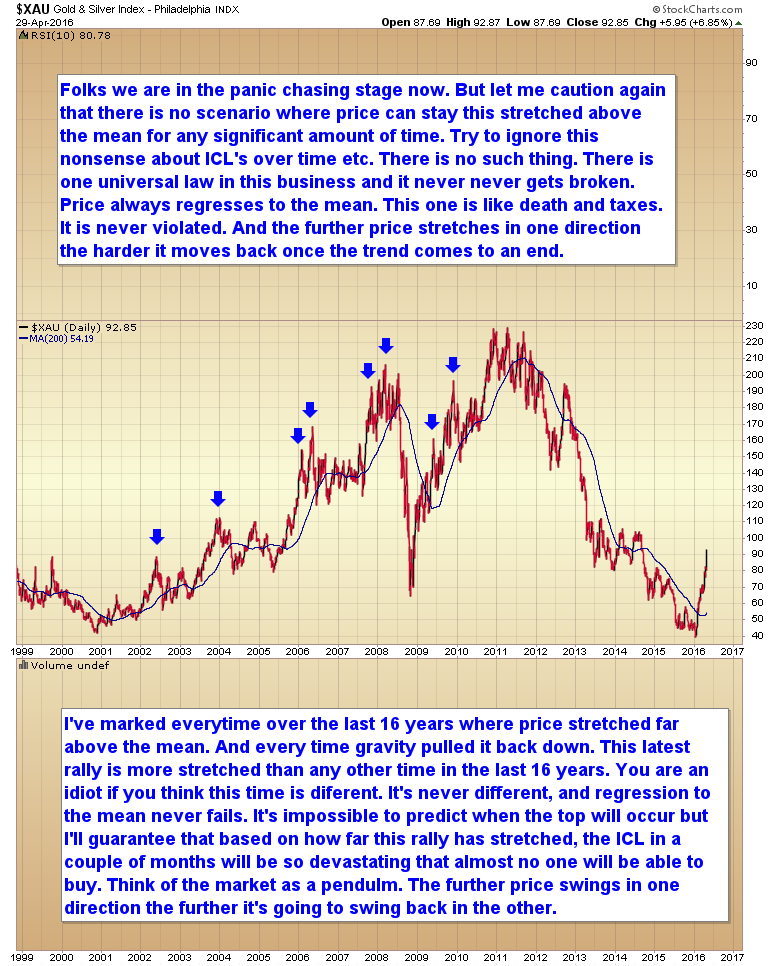
Folks, we are in the panic chasing stage now. But let me caution again that there is no scenario where price can stay this stretched above the mean for any significant amount of time. Try to ignore this nonsense that intermediate cycle lows can occur as sideways consolidations measured only by time, and not include a correction in price.
I’ve marked every time over the last 16 years where price stretched far above the mean. And every time gravity pulled it back down. This latest rally is more stretched than any other time in the last 16 years. You are an idiot if you think this time is different. It’s never different, and regression to the mean never fails.
It’s impossible to predict when the top will occur but I’ll guarantee that based on how far this rally has stretched, the intermediate cycle low (ICL) in a couple of months will be so devastating that almost no one will be able to buy. Think of the market as a pendulum. The further price swings in one direction the further it’s going to swing back in the other.
Like our new Facebook page to stay current on all things Smart Money Tracker
Smart money unloaded about 122 million worth of GDXJ shares onto dumb money retail traders today.
Don’t say I didn’t warn you…
Only Old Turkey’s should be holding now. Everyone else should at the very least have a tight trailing stop on positions, and only an idiot would be buying right here unless you are just day trading.
The volume in DUST the last couple of days has been eye popping.
Did some quick math and volume alone can be misleading as DUST is only $1.32 now.
Looking at the actual money flows between NUGT and DUST when price i brought into the picture, the money flowing into NUGT is dwarfing that of DUST.
DUST: 1.32 * 117,542,377 shares = $155,155,937
NUGT: 119 * 9,153,729 shares = $1,089,293,751
To you guys who might be questioning Gary …You might want to watch Options Action, today’s episode on CNBC. …ya I know “bubble vision” tv. But that show can be pretty good ..straight up guys …
Bottom line Carter Worth, of Cornerstone a Macro, good technical guy 2 weeks ago gave a buy in GDX …today went over various technicals, some of which Gary is sighting, as to why this run has gone too far, too fast. Each trader is starting to put on spreads to short GDX with a exact predetermined risk exposure.
Btw …they are starting to get bullish on biotech….hmm…
Btw …those guys are long term Bulls …they just feel this portion of the run has gone too far …
Gold and silver stocks are definitely overbougtht, but they are nowhere near overvalued. This last bear market destroyed valuations of good mining companies so severely and ridiculously that a move like we have had in the last few months was inevitable.
I remember in 2010/2011 the absurd values of some mining companies, especially explorers. We are nowhere near that today. The good companies are rising as they should be and the crappy juniors are basically doing nothing. None of the miners that I own are overvalued at this point. They need to at least double from here to be fairly priced. I do not buy any companies that are in GDX or GDXJ either.
Gary, With all due respect, you can also have a combination strategy of core holds (your Old Turkey) and some trading shares to move in and out of based on TA signals and Cycle work. I have both and have moved in and out of some of my trading shares during this run based on TA and Cycles. Thus far, we have not seen an IC trend line break in either Gold or the Miners so there has been little reason to to sell positions in either portfolio.
With respect to your chart above, it does show the norm. Here is a link, however, that shows two time based Consolidation IC Lows for the USD circa 2014 during its initial Bull move. I maintain that it is “possible” that we have just seen something similar in Gold and the Miners. If not, I feel that I am nimble enough, given my entry points to get out with some very nice profits.
https://goldtadise.com/?p=368426
Comparing the USD – the world’s least volatile currency – with possibly the most volatile sector in the world, it’s like comparing apples with monster trucks.
Perhaps, but lately the USD has been very volatile to the downside. The point of my post was to show that, at the very beginning of Bull Market moves, many assets experience moves for perhaps a full year or 2 Intermediate Cycles, without much of a pullback. The ICLs are very mild compared to what investors experienced during long Bear markets.
My last chart in the post above shows Gold’s move out of the 2007 low. The Pendant formation and mild initial ICL is very similar to the move we are seeing now. The HUI, out of the 2001 low, also had very mild pullbacks at the first two ICLs. I’m not saying I’m right and Gary is wrong here as I am not certain of anything. Rather I am open to a number of possibilities and will let the charts guide me.
In finance, mean reversion is the assumption that a stock’s price will tend to move to the average price over time.
Using mean reversion in stock price analysis involves both identifying the trading range for a stock and computing the average price using analytical techniques taking into account considerations such as earnings, etc.
When the current market price is less than the average price, the stock is considered attractive for purchase, with the expectation that the price will rise. When the current market price is above the average price, the market price is expected to fall. In other words, deviations from the average price are expected to revert to the average.
Mean reversion should demonstrate a form of symmetry since a stock may be above its historical average approximately as often as below.
Did Shanghai just blow a hole in the old gold market?
Remember, Shanghai is a physical only exchange and China is now “willing to bid up the price in order to secure physical metal.”
https://goldtadise.com/?p=366774
http://news.goldseek.com/GoldSeek/1461954811.php
PRC regime is behind the unusually sharp rally in gold then. They are up to no good, may perform a pump and dump operation?
Never trust the PRC.
Here is what some of the miners did in their first leg up off the 2008 low and the first pullback.
GDX – up 185% followed by 22% decline
ABX – up 137% followed by 37% decline
AEM – up 184% followed by 26% decline
GG – up 156% followed by 24% decline
NEM – up 115% followed by 24% decline
PAAS – up 113% followed by 33% decline
Youre comparing tops from a strong running Bull market to a bottom coming out of oversold conditions, not the same. Look at 1992, 2008 for examples. Im not saying this wont correct, it will. But how much ?? who knows, but I seriously doubt itll be to the degree youre promising unless its the resumption of the bear market in gold, which you say is over and this is the baby bull beginning. Youre beginning to sound angry and condescending Gary, quit letting the trolls get to you.
“The market can stay irrational longer than you can stay solvent” (or sit on the sidelines)
I fully agree, the reaction from an very oversold bottom should be stronger than in 2008-2009. Looking at 2001-2002, the HUI went from 35 to 150 with minor corrections, after that there was a big correction of 40%; with several stocks -50%!
And this all happened with gold only up 30%.
So Gary is completely right, sooner or later the GDX will correct hard, the question is when?
Gary Gold as moved up for 5 month and this IC top is being extended for so long. can the ICL be only 2 months? or will that also be a 5 months ICL because gold’s IC top took 5 months?
It should only take a month and a half to 2 months tops for the metals to correct. Miners will retrace at least back to the 50% Fib and maybe the 62%. So it just depends on how far the rally moves up as to how deep the correction will be. If we assume that GDXJ can reach the 200 WMA at 40 then the retracement will drop back to somewhere around $28 to $26.
Remember ICL’s have to create lots of fear. Assuming we don’t get an intervention next week stocks (and the dollar) are going to create some fear in those markets next week as they form an ICL (dollar) and half intermediate cycle low in stocks.
Gary,
Would GDX also correct to 50-62% retracement? Or will they retrace say only 38.2% since they consist of stronger companies than GDXJ
Gary,
Will “Sell in May and get the H away” apply to stocks as well as gold then?
And the 6 million dollar question: What will Oil do in midst of all this then?
History shows that the present rally could continue for several more months. Back in 2001, the $HUI bottomed at $35.31 but didn’t break out of its bearish trendline until the beginning of 2002. From the breakout point, the $HUI rallied from apprx. $66 to $155 in a span of 7 months, for a gain of about 235%. From the bottom to the top move took 20 months generating a monster gain of about 439%. Yes, price consolidated about 38.2% before breaking out above trendline resistance, but again – that pullback was BEFORE breaking above trendline resistance. After the breakout it was 7 months of pure price explosion.
I don’t see why we couldn’t be in the midst of a similar move, especially since the mining stocks started this rally after a prolonged and brutal 5 year bear market and so much more undervalued relative to the price of gold than in 2001/2002. An “echo” rally similar to the 2002 breakout rally would indicate we are only in month 3 of 7, with a target of $327 for the $HUI by October.
Am I telling everyone to pile in now? Nope. Just saying – there is past performance that could be prologue here, and if ever a “reckoning” was due a sector, the pm mining sector, given the destruction of value over the past 5 years, is worthy candidate.
http://stockcharts.com/h-sc/ui?s=$HUI&p=M&yr=20&mn=0&dy=0&id=p04797056358&a=456726792&listNum=1
Oops! Make that a 6 month move in 2002, not 7 months, so the HUI would be closing out month 3 of 6, with an “echo” target of $327 during July of this year…sorry about the bad math in my original post…
http://stockcharts.com/h-sc/ui?s=$HUI&p=M&yr=20&mn=0&dy=0&id=p04797056358&a=456726792&listNum=1
In terms of major bottom echo patterns, here is a 2009 GDX analog post from Mark over on GoldTent (very sharp and someone to watch). Here is a quote from Mark and a Link:
“Take a look at 2008. We got a move from 17 to 32 in a very short period of time but never more than a split second 38% pullback before the consolidation build started leading to a multi-year run higher. You would have had to be extremely lucky to nail the one day of the 38% pullback. It wasn’t worth trying to be cute.”
https://goldtadise.com/?p=368466
I think the 2002 breakout rally applies more to today’s circumstances rather than the 2008/09 breakout rally. For example, the 08/09 rally occurred after only a one year downturn, making a “V” bottom after a nasty and sharp decline.
The 2002 breakout occurred after a 5-year bear market, like the present case. As mentioned – the only difference is how much more radically undervalued pm stocks are starting out relative to the price of gold.
Agnico Eagle (AEM)
Anyone who bought AEM on the TSX, and held them during the period March 26/10 thru Oct 18/11 can file a claim to receive their portion of the settlement.
Court approval of the Class Action Settlement against Agnico Eagle Mines provides for the payment of CDN$17,000,000 by Agnico.
– for losses suffered as a result of Agnico’s alleged failure to disclose ongoing operational issues at its Goldex mine prior to the suspension of mining operations at the Goldex mine in October 2011.
– eligible shareholders have likely already been contacted by mail.
– deadline to file a claim for compensation is May 20/16
Pingback: Breaking News And Best Of The Web — April 30