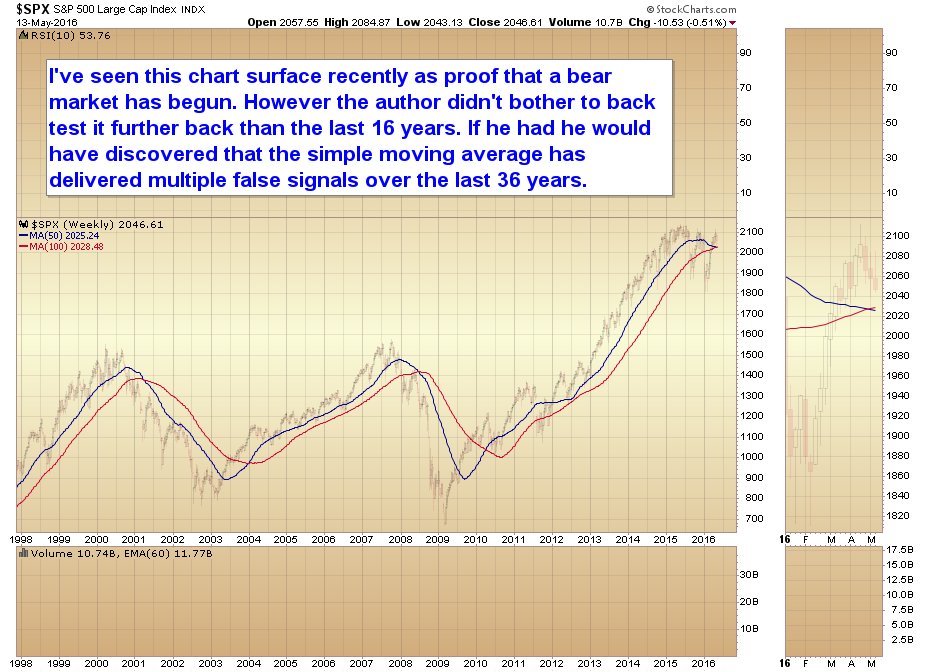
I’ve seen this chart surface recently as proof that a bear market has begun. However, the author didn’t bother to back test it further than the last 16 years. If he had he would have discovered that the simple moving average has delivered multiple false signals over the past 36 years.
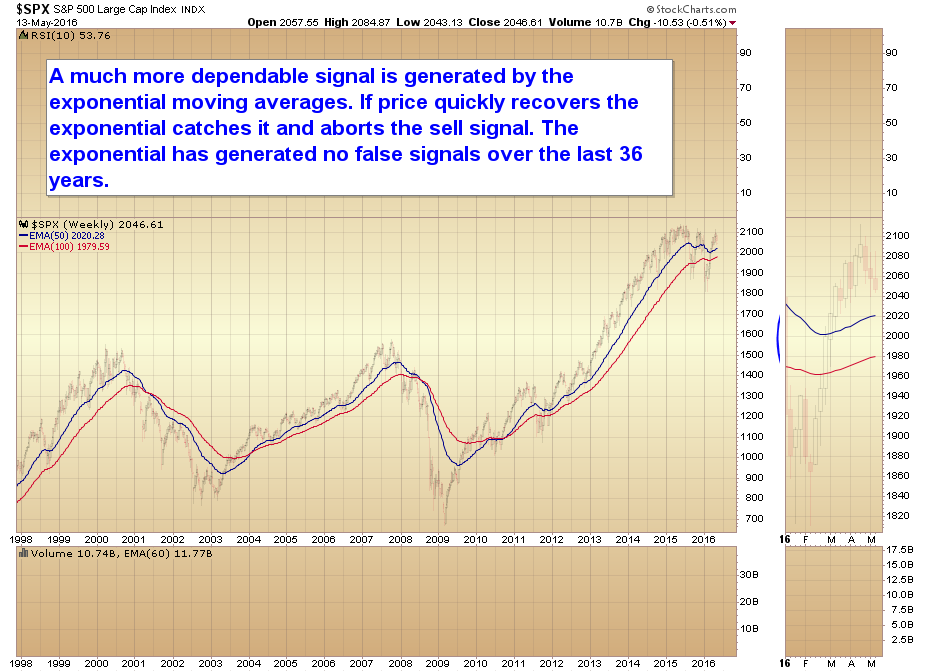
A much more dependable signal is generated by the exponential moving averages. If price quickly recovers the exponential moving averages catches it and aborts the sell signal. The exponential has delivered no false signals over the past 36 years.
Like our new Facebook page to stay current on all things Smart Money Tracker
1) If stocks market cannot snap on the upside when treasuries have commenced their DC decline & commodities thrust up (with oil on its way to ICH=49 this week), then …a stocks bull would again rely his bullishness on anticipated relative strength and not on fact.
2) SPX makes a poor benchmark for analysis. DCL in stocks was back in April.
NYSE, transports, discretionaries, NIKKEI, Hang Seng have been very good in clearly charting that DCL while NASD and INDU somewhat less clear but yet clear enough that we are now 1 month into a new DC which has already FAILED for Hang Seng, transports and NASD.
Hang Seng particularly is the most explicit: it is now in a failed DC after bouncing off its 200dma — so classic.
One discounts so much weakness data about the stocks market worldwide on his own expense.
On the contrary the S&P and Dow are the most watched indexes in the world. When sentiment turns sour it will be expressed in both of those indexes, as well as the Nasdaq. Until those three indexes follow other markets down then we don’t have a DCL yet. The NYSE was pulled down in April by the energy stocks as oil dropped into its DCL. As a matter of fact I would point out that the drop in earnings that so many bears are using as an excuse for why stocks are in a bear market is almost solely caused by the energy stocks. Now that oil has bottomed that will reverse.
A DCL has to turn sentiment bearish. That is the purpose of a cycle low. To swing sentiment and reset the stage for the next cycle.
The McClellen oscillator is at -46. DCL’s have occurred at this level, but -60 or lower would be better and would generate more force out of the DCL for a test of the all time highs.
If we didn’t get the DCL last week then we are going to get it sometime this week. I’m thinking early, by Wed.
Gary,
Are miners/gold going to ever correct? Now 5 1/2 months straight up. I just can’t buy at these levels
There is always an intermediate cycle low. The rally in gold has at least 4-5 years to go yet. Do you really think it’s never going to deliver an ICL in that time?
I see where Goldman has finally recognized that oil is now in deficit. I warned everyone this was coming, but most people kept hanging onto the supply glut story long after the market had already recognized that the fundamentals had changed.
As I said in my last video the market has to make a half intermediate cycle low. Once that is complete we can construct the intermediate uptrend line.
Bressert Cycle Theory tells us that the first sign of a Bear Market is a Failed Intermediate Cycle (i.e. Left Translated with a lower low and a lower high).
This has clearly happened on the SPX with Nov 2015 lower High and the Jan/Feb lower Lows. So until we see an Intermediate Cycle make a higher low AND and higher high, we are very likely in a Bear Market for stocks, according to Bressert.
Meanwhile, LABU has perhaps the Ugliest looking chart on the planet since its inception. It would seem that you and your Subs had caught the “falling knife” as we start the move into the next IC Low this summer.
https://goldtadise.com/?p=369783
XBI making higher highs and higher lows. What do you mean by falling knife?
Near term it is but not on a longer term 5-6 month Intermediate Cycle basis. Bressert Cycle theory dictates that Longer Cycles, dominate Shorter ones (i.e. The Longer, or Primary Cycle sets the Trend that the shorter Cycle will take). We are bouncing today but also testing the down trend line from April 25th.
Hmm the Dow did make a higher high. It led the market on the way down in August and it’s leading the market up out of the 7 YCL.
Right now the DOW is below your breakout line. In technical terms this is considered a “failed breakout.” The same thing happened during the 2000-02 Bear Market where both the Trannies and the DOW had false breakouts about one year in, after which stocks collapsed back into bear market mode.
I am open to being wrong here, but I see the current setup as a Fractal or Analog to the 2000-02 Bear. A slow grid down that frustrated bulls and bears alike. Until I see a higher IC Low this summer, this is a dangerous market to be long in, especially with 3x vehicles. JMHO.
The second chart in this link shows the failed breakout by the DOW back in 2000-02.
Again, I am open to being wrong but the 2nd chart clearly shows that a 7 Year trend line break does not “guarantee” anything. A higher IC High and higher IC Low is a much more dependable bottom confirmation from a Cycle methodology standpoint.
https://goldtadise.com/?p=369706
Good!
Things are moving as forecast through my weekend comments –> treasuries have begun their DC decline with 2 effects:
– crude oil and $CRB are thrusting up towards their ICHs
– stocks are advancing too but at a much less spirited pace since they are already in Yearly Cycle decline.
Wednesday’s FOMC minutes & oil inventory report will make the catalysts for delivering :
– the ICHs both in oil (at 49) and in $CRB,
– the DCL of treasuries (the first in this new YC),
– stocks resumption of their decline.
Be ready to unload commodities on Wednesday.
This short leg-up in stocks anticipated over my weekend comments should be used to dump any unwise stock investment such as a weak biotech sector and any offensive stocks.
I’ll start loading TMF on Wednesday.
Biotech has broken the daily cycle trend line, it may be leading the market out of the DCL.
Dennis G(F)artman now bullish on gold!! After it rallied relentlessly for 2 months!
DEFINITELY time to get out of gold now into summer low.
Like I said FRI at close posted here, went LONG FRI
This is how I make $$$$ Trade
Not Bad……
A Nice $12 water fall plunge in Gold from 1288 to 1276 right before Noon EST.
A Nice $12 waterfall plunge in Gold from 1288 to 1276 right before Noon EST.
Gary,
What to make of this mkt rocket higher today??
DCL is IN?
After this I do not believe PPT will let SPX going below 2040 in the foreseable future. This GS input on Crude is acomplishing that goal.
Two thumb up for Gary.
If you can make me money this time, I will pay for it, regardless money guarantee or not..
IBD monthly charts look long in the tooth and haven’t have the necessary correction / bear market.
https://youtu.be/TAwjc8BFdqQ
Anfield Gold up another 30% today and Silver Lake up 22%.
No need to play the Banker whipsaw 3xers like NUGT (up less than 5% today)
BYE BYE BEAR MARKET BORES!
SPX ICL just a shrinking imag ein the rear view mirror now…
Gold mid day reversal tell tale …
Oil is in charge and at large
Kudos to Gary
Not so sure…technicaly the confirmation of DCL done, only with SPX well above 2085!… At this point I do not know if the mkt is in a fall in slow motion until June 22nd-29th where it lies a conjuction of extremely crucial events: BREXIT vote, Spanish elections, BOJ, ECB and FED/FOMC decisions!!
Here is the SPX Wedge that I am watching from a Cycle perspective.
https://goldtadise.com/?p=369895
Here is a great post by Plunger, one of the great Bull/Bear Market historians out there. This guy has studied them thoroughly and understands how markets transition from Bear to Bull better than anyone I know.
Plunger has turned from “Perma Bear” on Gold to a Raging Bull.
This is well worth reading even it he may be a bit over zealous regarding his thoughts on corrections, (Gold will correct at some point).
https://goldtadise.com/?p=369887
Anyone seen consecutive Cup & Handle set ups before, where you’d think moving averages were also stretched etc?
If so , what was the result?
I’ve taken Gary’s advice and been avoiding getting back into the goldies but the failed breakout last night (I’m in Oz) is a concern. But it’s moving up again as I write this…………
I’m not sure about cup & handle patterns, but in reviewing a handful of initial Bull Market moves (some in Gold but also the Dow 1982 bull breakout, TLT beginning of 2014, and the USD later 2014), all showed a pattern of 10-12 months before the 150 ema on the daily caught up to price, usually in a sideways consolidation. I am not saying that this will happen now but I am saying that it may be possible as you can see similar bull patterns in the charts.
So many Guru’s are saying wait for the pullback but what if it doesn’t come? If it is a bull market as we all suspect, I think its best to get a seat on the bus as it won’t matter 5 years from now if your entry was perfect or not.
Thanks Surf City, really appreciate your posts here & on goldatise. I’ll check out those moves. Re seat on the bus, I know what you mean, but I fear a sharp correction more than missing a day or 2 of the next leg up, so thinking about it carefully. Reckon I’ll be back in if it gets through 1300-1310 area. Cheers
Lets move to the SPY chart, there is a bigger head and shoulders brewing!
Normally this is a BEARISH SET UP, and could be a warning here. And this
head and shoulders is a pretty clean one…..
SUMMATION – still on a SELL signal
The nasdaq does not look strong, its down below all the avearges.
The A50R, is at 58 so no matter what happens, this is a market still at fair valued
but in the past, in a move like this, it meant the market was about to experience
another sell off.
The VIX looks like it want to rally here, and a low risk trade would be to BUY the VXX
and leave a short stop at 12 or so. That means, if wrong losses would not be big.
Everytime we get down to 12.5 the VIX tends to rally, back to 30 or so.
On the contrary, Naz was the strongest of the 3 main indices today; and that is a good sign for bullish case.
Technical analysis don’t mean a hell of beans in a highly manipulated stock market, sorry.
Anthony, Who told you that? Everything shows up in the charts in the form of price action, including manipulation. Without TA and Cycles, placing trades would just be a wild guess at best.
Friendly bet Gary,
Looks like you will be wrong on gold this time. Sideways consolidation from here as it doesn’t seem it will ever pullback to 1200, now 5 months. The analysts were right!
Sure I’ll bet a burrito on that one. By June gold will have dropped into an ICL and I’ll get to say I told you so.
Those looking for some Budget Oil producer stock check out ORIG
https://s3.amazonaws.com/tradingview/snapshots/p/p8K2kTIS.png
Crawford, wise comments!
CRB index and oil are ripe to post their tops tomorrow.
CRB will find its ICH at 50Wma which, once touched tomorrow, will cast commodities into intermediary cycle decline AND DRAG STOCKS MARKET ALONGSIDE THEM.
The only wise investments are defensive (treasuries – the longer the term the better).
furthermore, the weekly charts of TLT and $USB should be checked –> beautiful bullish triangle ripe to breakout to new historical highs.
But, but, but – no one’s paying attention to Birdman.
Everything is gloom – nothing will zoom!
(my interpretation of his long epistles)
He hasn’t changed his mind in at least two weeks.
That must count for something.
…and gold is joining hands with treasuries in signaling that commodities are on an exhaustion up-thrust: a top above 1300 a couple of weeks ago and maintaining a tight range around 1275 despite USX on a 2-day pullback after a 50dma kiss.
USX will move to higher ground tomorrow as treasuries reach DCL, commodities top and stocks resume their decline (mind the USX-stocks negative correlation since FEB)
Watch Dax. If cash market clears 10110 ish, it may rally even more. Bringing US market up too. And look at NDX, macd is ready to cross upwards. All these may lead to a follow through day today. A day 8 follow through day.
Guys I want your opinion on something…Gary says that going ”Old Turkey” we can surely make money with Energy,Oil,Biotech,PM…my question is: since on long-term every each of these sectors will eventually rise based on Gary and the charts, isn’t it a good idea to buy and hold 3x Etfs ? I know that they can go much up and down per day, but on the long term it’s a sure win since the whole sector is going up, isn’t it ?!
No, because of 2 reasons:
1) general reason: leveraged and inverse ETFs are like buying options – they erode their value considerably in time and especially on volatile price action.
these kind of ETFs work best just as options for their buyers: for short investment periods (several days usually or a couple of weeks at most) and on a strong trending market; range-bound markets are a killer.
2) specific reason: Old Turkey is not applicable to stocks which are still in a bear market and potentially also commodities –> $CRB may provide an undercut on Far East problems to emerge soon out of Japan and China.
Thank you Alex for your response! For example, looking at the chart of NUGT, I see that in 2013 the price of it was more than 2-3k USD…today the price of it is something more than just 100 USD…we are talking about a huge difference! There is no way that the price will rise again to 2013 levels and holders make enormous profits ?! Alex, which are the sectors you believe have potentials and do you trade specific stocks or ETFs ?
1) Correct. No way to reach those levels again. Time and the volatility of the underlying asset (gold miners) has eroded NUGT ETF’s value.
2) I trade only assets (ETFs too) with ATR% < 5%
assets too volatile are out of my investment spectrum because I cannot implement my risk management rules on them.
Thank you for your insight. Do you believe it’s worthy to put some money to GDXJ, XOP, USO and UNG for long term purposes e.g next 3/4years…?
Nasdaq is starting to look very much like a 2nd lower high… Could get smashed over the summer.
Bellweather AAPL is in long term decline.