Weekend Charts: $SPX, $NYAD, $NYA, $INDU, $MID, $RUT, $FTSE, $CAC, $DAX, and $NIKK.
I like the odds that Friday marked the bottom of the daily cycle and half intermediate cycle decline. The next daily cycle should be right translated as well and rally at least into the second week of June before the market starts to get nervous about the Brexit and we get another corrective move.
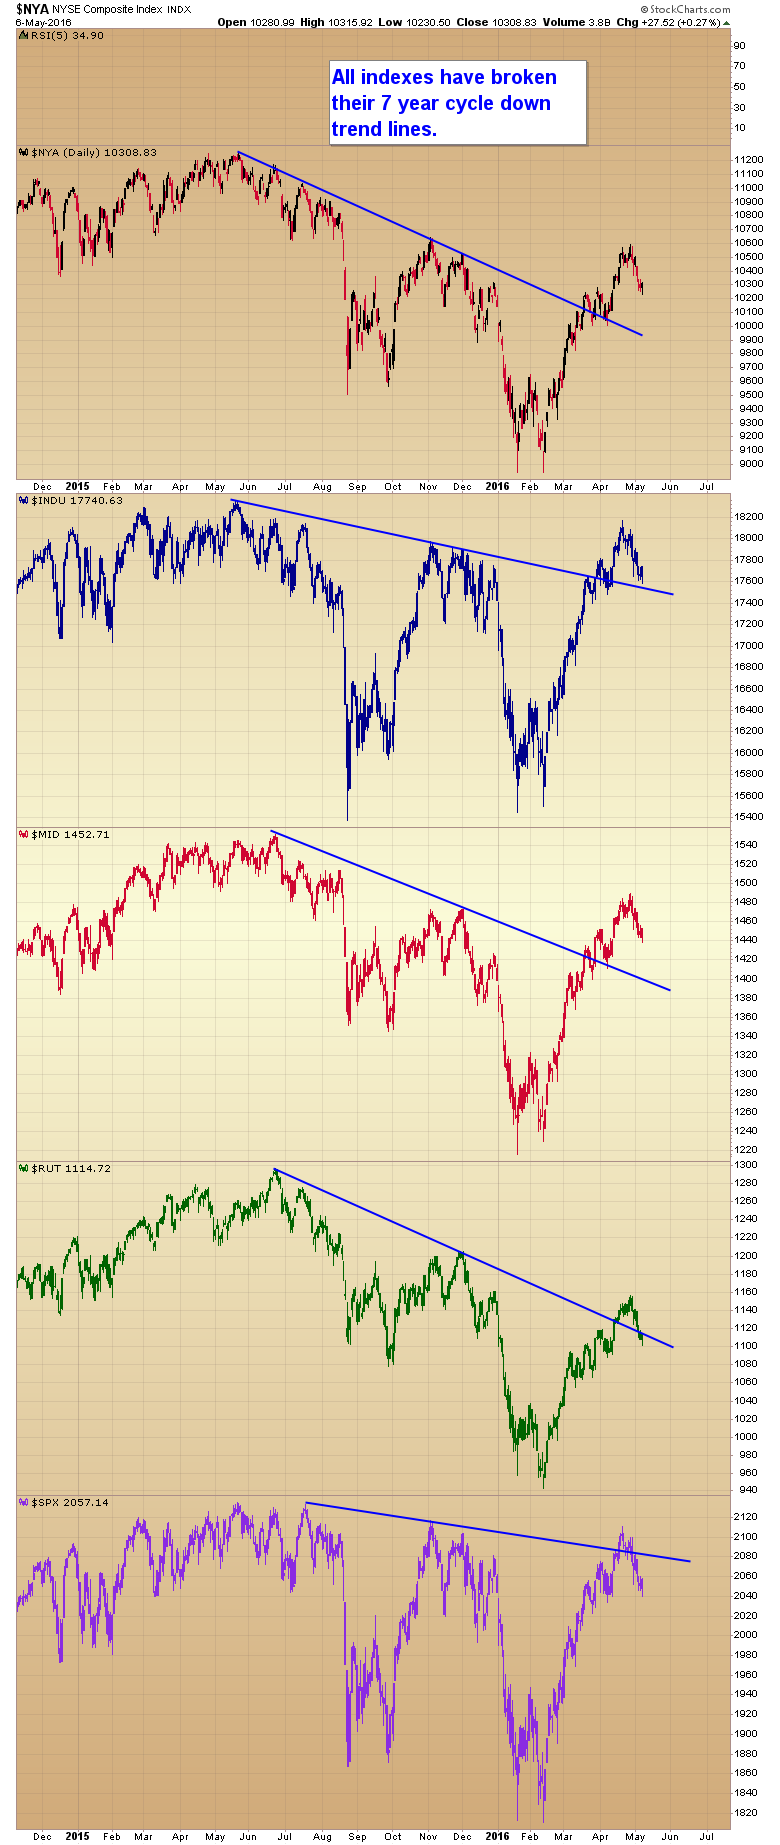
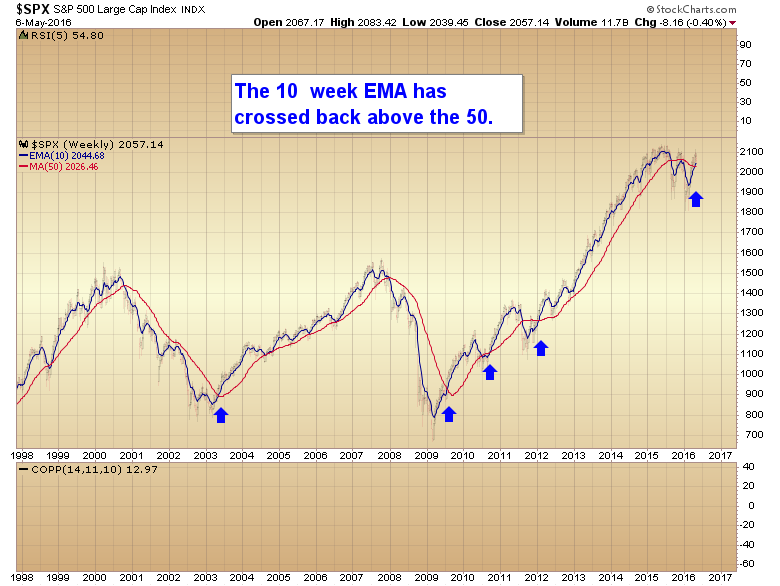
At this point there is virtually no doubt that the 7 year cycle correction is finished and the next phase of this QE driven bull market is beginning.
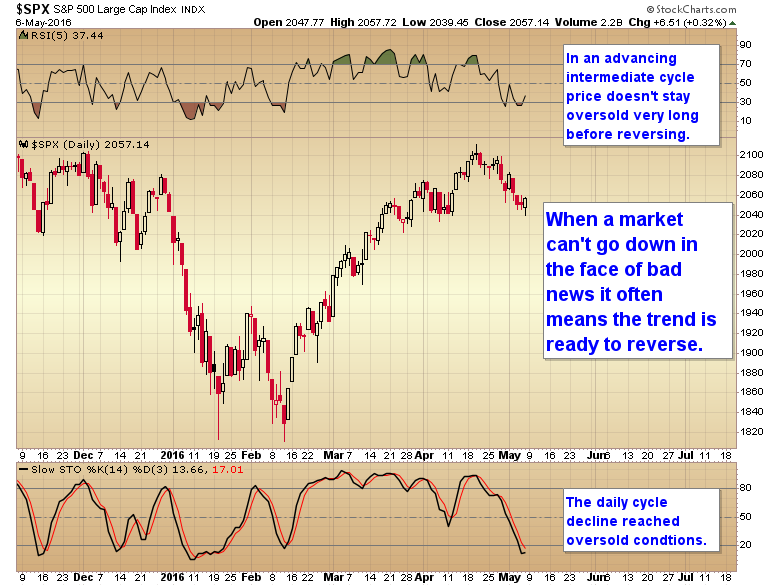
In an advancing intermediate cycle price doesn’t stay oversold very long before reversing. The daily cycle has reached oversold conditions.
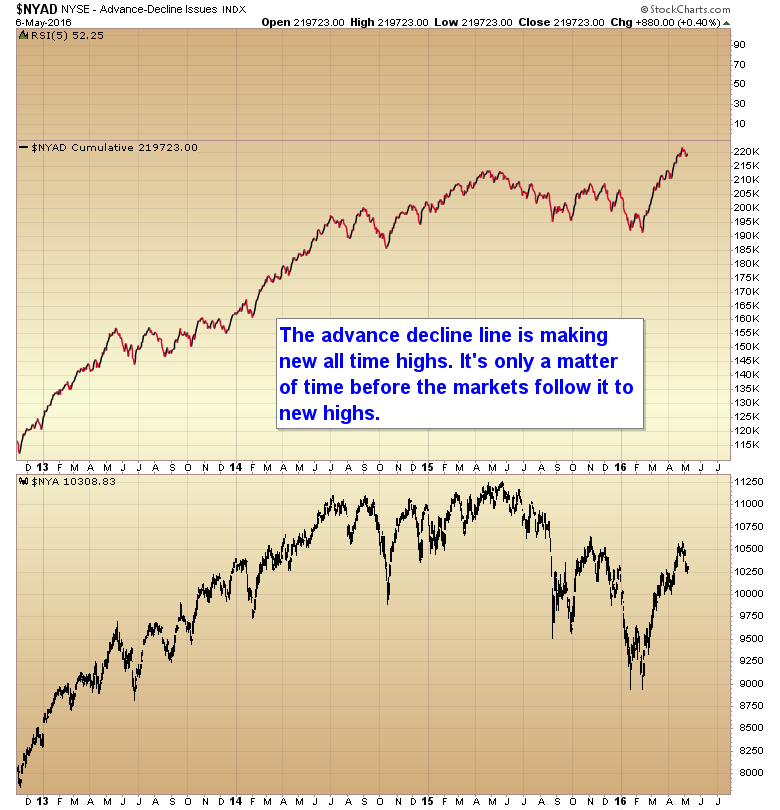
The advance-decline line is making new all time highs. It’s only a matter of time before the markets follow it to new highs.
All stock market indexes have broken their 7 year cycle down trend lines ($NYA, $INDU, $MID, $RUT, and $SPX).
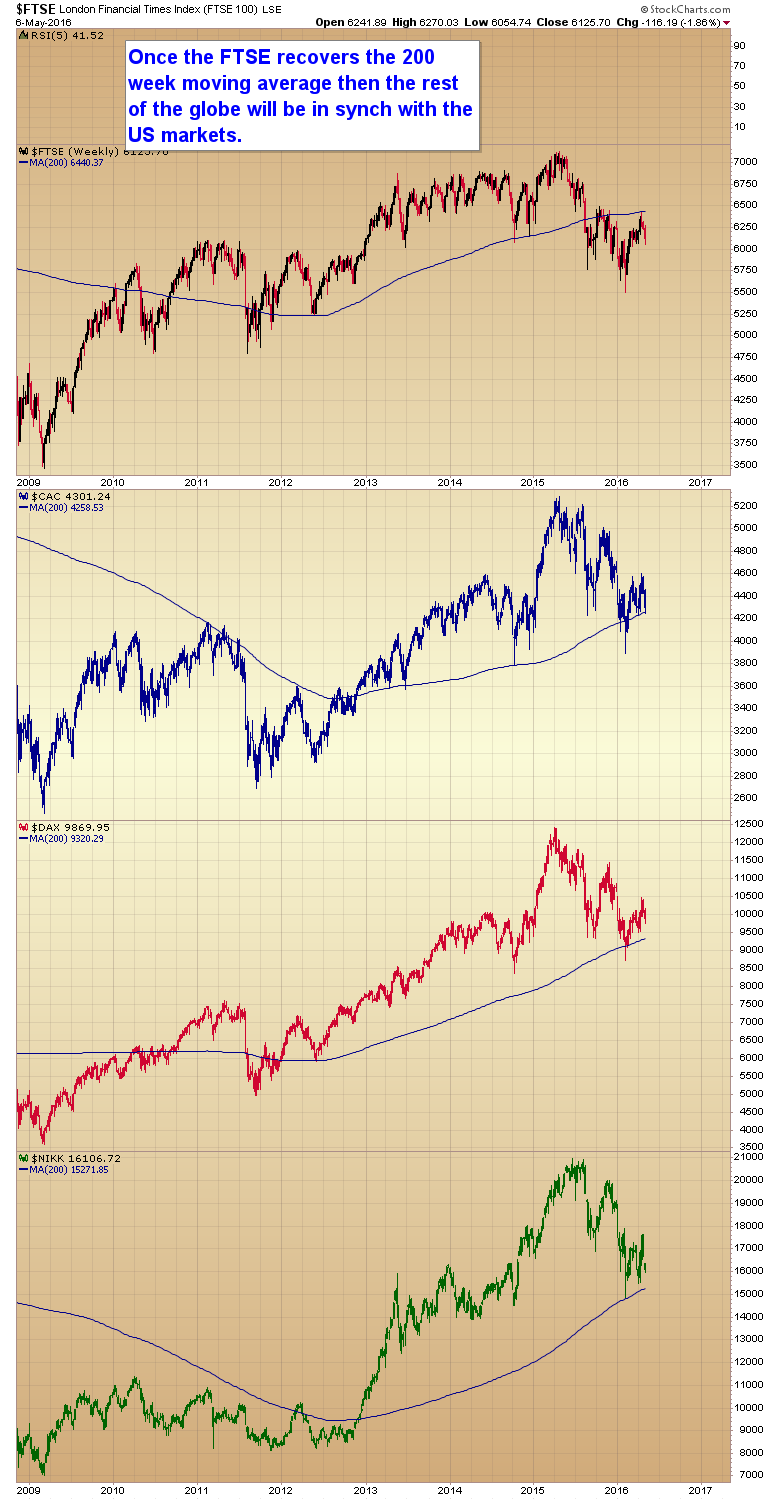
Once the $FTSE recovers the 200 week moving average then the rest of the globe will be in sync with the US Markets ($CAC, $DAX, and $NIKK).
Like our new Facebook page to stay current on all things Smart Money Tracker
Great charts and commentary as usual, Gary. I must say that you’ve shown great patience and resolve in the face of much criticism over the past 2 weeks. Obviously lots of newbie subs got on board recently. I think you’re doing your best to keep them calm. Great job guiding us all through this DCL so far. Like I said before, hope you never lose your desire and passion for doing this stuff. I think what separates you from all the other sites is that you’re truthful and pretty acurate about what you see happening in these markets, most of the time. Even if you don’t always pick the best entry/exits. As you said, those are sometimes hard to time just right. You seem to really want people to understand and learn your methods and be successful at this. Much thanks to you and above all stay patient. Many of us really appreciate your work.
And just in case anyone is wondering…. I am a regular subscriber here who only posts maybe once per month, sometimes less. I do not know Gary personally, and I’m not a shill or a troll who is getting paid to misinform or mislead anyone. It’s why I usually don’t post on Forum side. Just saying…
Based on your own trendline SPX is having a hard time breaking the 7 year line.
Look up Advance decline line excluding ETFs , preferred and other structured products…..IT is NOT making a new high.
You get Sentimentrader based on your comments in the past…..have you seen a strong bull trend when Smart money confidence was a good 35 points below Dumb money confidence?
Absolutely. Look at the last time the market came out of a 7 YCL (2009) Smart/dumb money confidence got much more extreme and stayed that way for almost a year.
Things act different when they come out of a multi-year cycle low.
Perfect case in point. Two months ago all the usual analysts were calling for a crash and resumption of the bear market in gold because the COT had gotten bearish.
I said at the time that the COT would behave differently now that the final bottom was in for gold. I warned not to short a baby bull.
I think we can all agree that I was correct on both counts.
I’m for sure that we will pullback to the 1860 area, but won’t discount a test of highs. If we do start your thesis of ath rally, it’ll be the shorting opportunity of this year. The nfp was disappointing to the economy, but markets view it as kicking the rate hike can down the road which is favorable for risk on.
The single best advice I’ve given over the last 3 years is to not short the stock market. If one would have just followed that advice they could have saved themselves lots of pain, misery and losses. That advice is still pertinent.
You are fighting a rigged game with opponents that can print money at will. Needless to say their pockets are deeper than yours.
Gary, I think that it is possible that this current stock market downturn may be similar to the 2000-02 Dot Com Bear rather than the 2008-09 Financial Crisis. If you look at the charts from that timeframe, you will clearly see that many indicies (e.g. DOW and Trannies) broke the 7 year down trend line to the upside about a year into that slow developing Bear.
You will also see that this 2001 trend line break was a “False Breakout” in technical terms and once price moved back below the breakout line, the Bear market clearly resumed. We are now below the breakout line again, so is this also a False Breakout above your 7 year line? Time will Tell 🙂
TA and Cycles are useful at projecting possible scenarios but, IMO there are no “sure things” with markets.
Correction: The Trannies and SPX have moved below their breakout while the DOW is currently sitting right on it (potential support?). In any case, I agree with you that we very likely bounce here as stocks are over sold. The key to this whole market, however, is the next ICL this summer.
Will it be a higher ICL than Jan/Feb or a lower ICL? That is the true test of where we are and Mr. Market will determine that and no one else.
Weekend Ciovacco video on Stocks, Bonds and Commodities. Part of my Saturday morning routine 🙂
https://www.youtube.com/watch?v=sXFUYfSCNPg
Gary, $usd undercutting the low near 92 just to reverse and start a rally usually could be done in two weeks. That would be two weeks of rally in market. And if that happens, I would bet all markets will start declining other than $usd for the summer until $usd is done rising from that undercut low to near the highs of 100. This way we will have two weeks of rally and then downtrend begin for the summer, hard down in June and recovery in July-August.
It’s hard to say if the dollar still has a chance to undercut. I certainly wouldn’t try to trade it. The trade now, if one is so inclined to trade currencies, would be to go long the dollar.
“Instead what we saw was a professional stop run creating a head fake for the retail investor (all of us) which put in the final bottom”
Well the SMT susbcribers weren’t head faked 🙂
I knew exactly what was happening…
These analysts like to make a big deal of calling the bear makret correctly. What they won’t tell you is that over the last couple of years they lost money on roughly 35 out of 40 short trades during the time gold was still in a bear market.
Like I’ve said many times in the past, markets go down differently than they go up. It’s tough to make money on the short side, even in a bear market.
But if you did, why did you miss the last 30% on the miners?
How can a 200 week moving average be of any value? I have never see
n anyone use that one before.
I use it as a measure of whether a market is in a cyclical bull or bear market. If price drops below and especially if it turns down then a cyclical or secular bear market has begun.
I also find it odd, you use a 200 week moving avg. the market could drop 50% and it would still be above the 200 weekly moving avg.
Ftse 100 looks pretty bad, death cross as of march 24th, looks pretty similar to 2000. 2007. The “bubble phase” as predicted here has by no means come to fruition.