Chart of the Day – Dollar, Gold and Silver
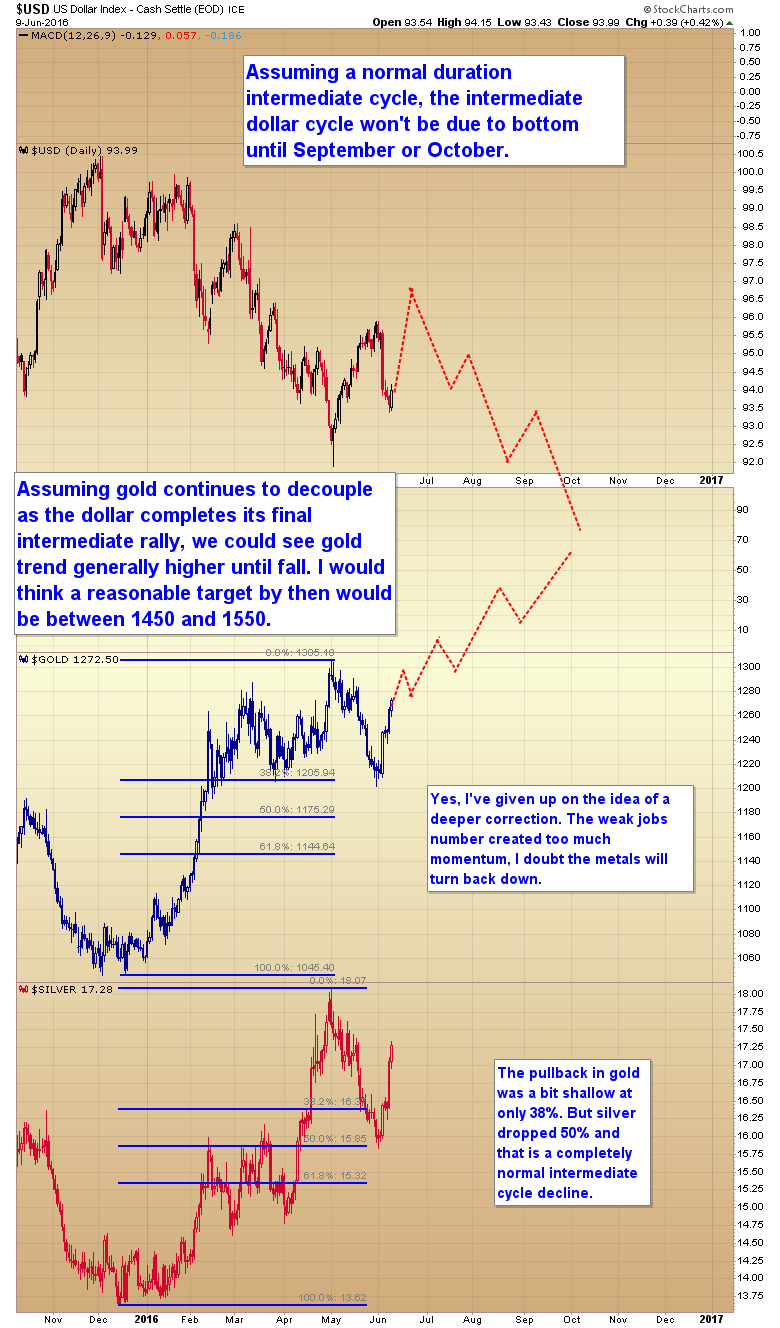
$USD – If the dollar gives us a normal duration intermediate cycle, it will not be due to bottom until September or October.
$GOLD – Assuming gold continues to decouple as the dollar completes its final intermediate rally, we could see gold trend generally higher until fall. I would think a reasonable target by then to be be between 1450 and 1550.
$SILVER – The pullback in gold was a bit shallow at only 38%. But silver retraced 50% and that is a completely normal intermediate cycle decline.
Like our new Facebook page to stay current on all things Smart Money Tracker
Thanks Gary.
Gary,
The May low would be YCL for Gold then. The next ICL or the one after would have to be left translated to form a YCL?
Intermediate cycles don’t usually left translate in a bull market.
If GDM go over 760 it’s possible that it continue following fibonacci untill 1500?
perhaps next pivot high HUI anywhere between 320-370 based on fibo projections
What is the reason for decoupling of dollar and Gold? manipulation?
You’ve given up.
Translation
I was wrong.
HUI is already 140% up from its lowest 99, review historical price action in bull market, when HUI was going up to 130-150%, MUST have a 5-6(even 1 year) months consolidation. I am little bit worry about GOLD and MINER is just in this period. Will see.