GOLD MOVING DOWN INTO ITS DAILY CYCLE LOW
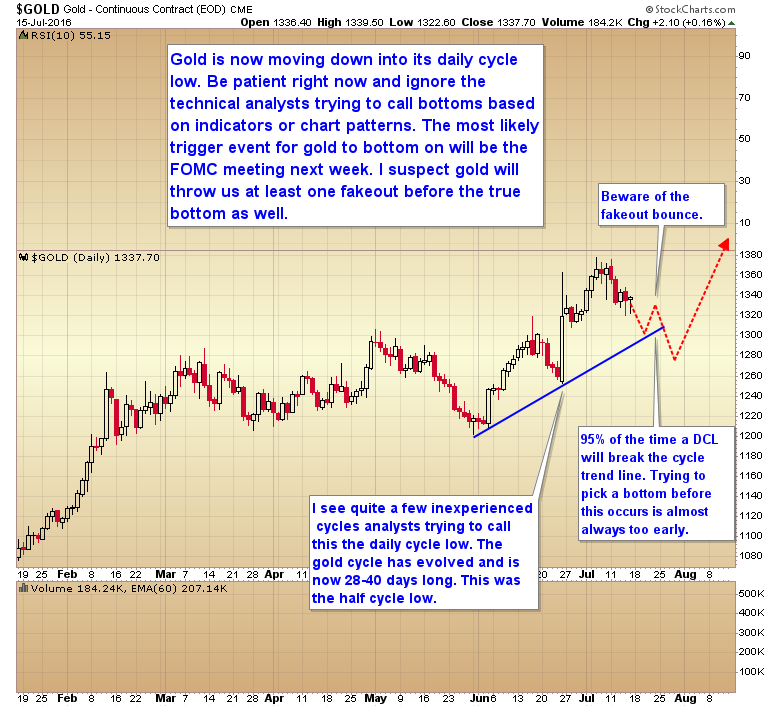
Gold is now moving down into its daily cycle low. Be patient right now and ignore the technical analysts trying to call bottoms based on indicators or chart patterns. The most likely trigger event for gold to bottom on will be the FOMC meeting next week. I suspect gold will throw us at least one fake out before the true bottom as well.
Like our new Facebook page to stay current on all things Smart Money Tracker
everybody knows fed not going to raise rate, right?
In a market as strong as the gold the DCL may not even reach the trend line and if it does
may not hang around for long.
Thanks, Gary. According your analysis, that is not a DCL, it should be a ICL?
This will just be a daily cycle low. The ICL occurred 5 weeks ago. the next one won’t be due till Sept. or Oct.
gdx pull back to 27 area?
Who was the idiot that said GOOG and AAPL charts looked terrible?
When will these people learn to buy low and sell high?
The time to buy is when things look bad.
Until one learns to do the opposite of their emotions they will never make much if any money in the markets.
This is where cycles help. When price moves into the timing band for a cycle low you know you need to do the opposite of what your brain is telling you to do.
googl and aapl look great on the monthly charts.
Early this year someone was pounding the table that $USD is dead and can’t even clear the 200 dma.
That may be but it has been hanging around that level for weeks and refusing to roll over… so imo if it breaks out it can make a quick run at the next resistance level.
This are central banks controlling the EUR/USD.
Yellen provided huge amounts of USD swaps versus the EUR after Brexit. This practically means that Yellen sells the EUR whenever a rebound in the EUR/USD occurs. This means limited upside for EUR/USD until Yellen get her USD swaps back.
Effectively I think that gold will go down in the next days …
If we break 1315, look below …
Using GLD as a proxy: https://postimg.org/image/wd7ase647/
our emotions are our greatest enemy
especially when it comes to trading
vix back to 12 region. Relief rally?
If you blink you will miss the DCL and GDX will leave you behind
Gary,
Why do you not regard the day of Brexit a DCL? It was about 18 days from the previous
A bit too early. For the last several years the daily cycle has been running 28-40 days.
any predictions on where the price of gold will be in January 2018? Thanks
Well the next two major multi-year cycle lows in the dollar are going to be due in the summer or fall of 2017, and then again in 2020. The most likely timing band for the final bubble top in gold would be in 2020.
I’ve always thought that top would be somewhere between $5000- $10,000. A huge chunk of the gains will occur in the last year as price starts to rise parabolic.