Monthly Archives: August 2016

CHART OF THE DAY – OIL

OIL

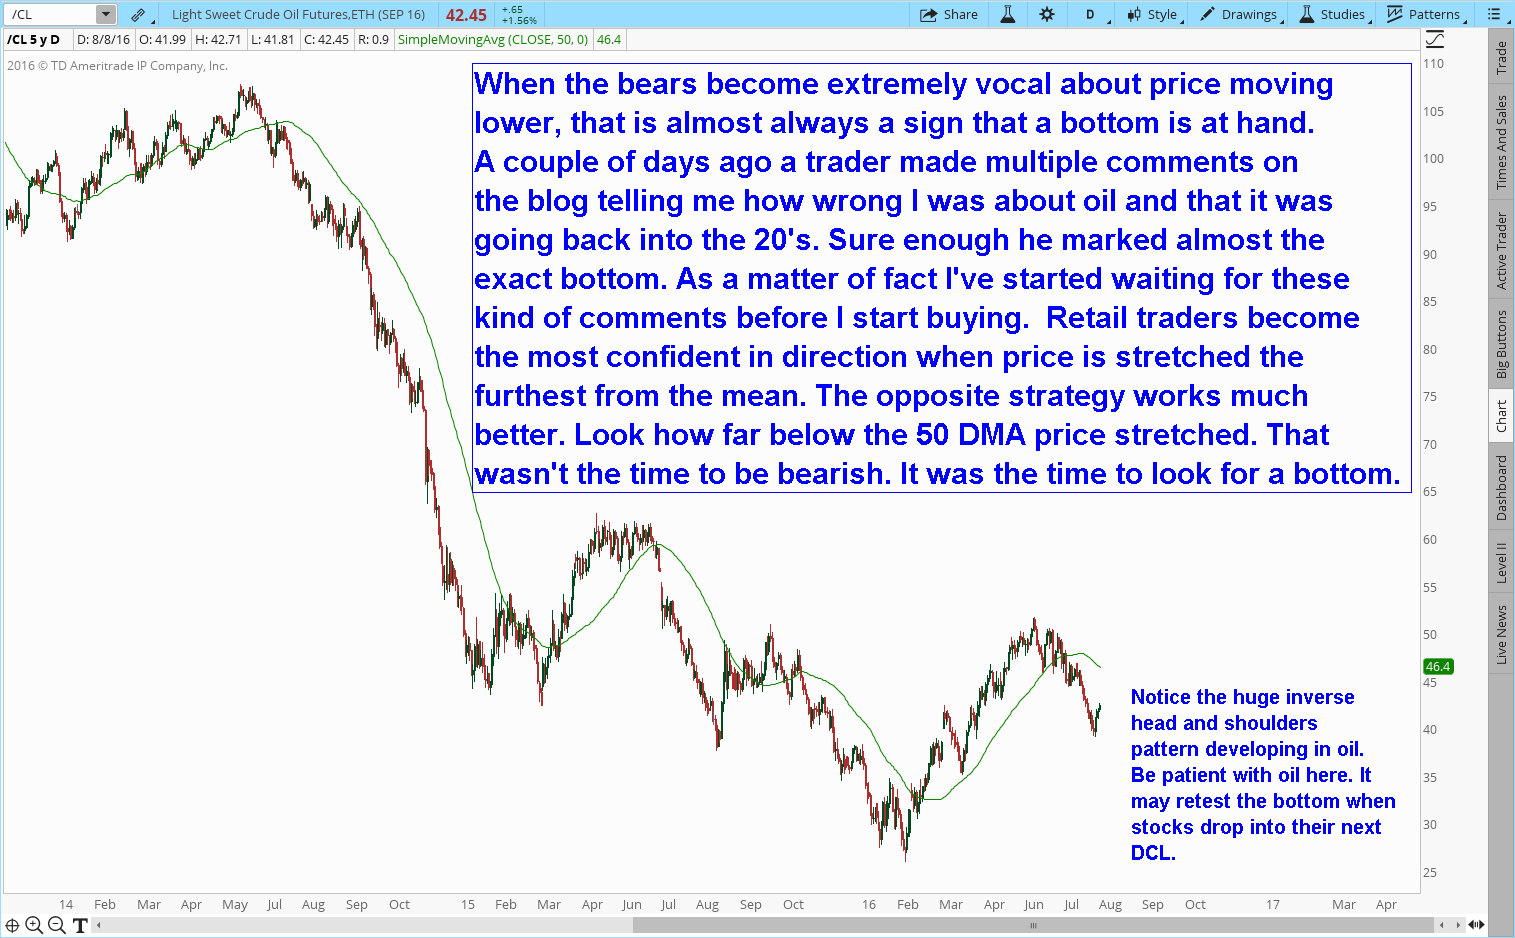
When the bears become extremely vocal about price moving lower, that is almost always a sign that a bottom is at hand. Retail traders become the most confident in direction when price is stretched the furthest from the mean. The opposite strategy works much better. Look how far below the 50 DMA price stretched. That wasn’t the time to be bearish. It was the time to look for a bottom.

oil

Like our new Facebook page to stay current on all things Smart Money Tracker

CHART OF THE DAY – BEWARE THE FALSE BREAKOUT

BEWARE THE FALSE BREAKOUT

Remember all those analysts that have been telling us the market was about to crash? Well, just like I predicted, the Nasdaq is now testing the all-time highs.

Beware of a false breakout early next week. This is how big money gets out of a position. They create a breakout and then sell to the clueless retail traders that buy the breakout. Buying breakouts rarely works in modern markets.

false breakout

Don’t forget 10% off the regular annual subscription price good for this weekend only. Buy a regular yearly subscription and I will refund $20.

Like our new Facebook page to stay current on all things Smart Money Tracker

CHART OF THE DAY – GOLD’S MULTIPLE RESISTANCE ZONES

GOLD’S MULTIPLE RESISTANCE ZONES

Gold has multiple resistance zones at the 1380-1400 level. It’s going to take some work to break through these. Gold will need some help from the dollar, which it will eventually get as the dollar will be due for its intermediate cycle low by the end of September or early October. Once the breakout occurs, gold should make a beeline for the 50% Fibonacci retracement, and then maybe to $1550 before this intermediate cycle tops.

Price is trapped between the 200 week moving average and the bear market trend line. I’m going to say that there is almost no chance of gold dropping back below the 200 WMA for the rest of this bull market.

GOLD'S MULTIPLE RESISTANCE ZONES

Don’t forget 10% off the regular annual subscription price good for this weekend only. Buy a regular yearly subscription and I will refund $20.

Like our new Facebook page to stay current on all things Smart Money Tracker

CHART OF THE DAY – GOLD: SIDEWAYS FOR AWHILE?

Gold: Sideways for Awhile?

In my last chart of the day I noted that gold and the metals sector in general were too stretched above the 200 DMA and would likely have to churn for awhile before the next leg up could begin. After seeing the sell off following Friday’s employment number I think I probably called that one correctly. The metals may have to churn sideways for most of August before the next rally begins.

Gold: Sideways

I’m going to go over in detail this weekend what I think the sell off on Friday in the metals means for the sector. Hint: It’s not that bearish.

If there are any of you left that haven’t gotten on board the SMT here is another chance. 10% off the regular annual subscription price good for this weekend only. Buy a regular yearly subscription and I will refund $20.

Like our new Facebook page to stay current on all things Smart Money Tracker

CHART OF THE DAY – REGRESSION TO THE MEAN

Regression Mean

Probably the single most powerful force acting on all assets is regression. All assets regress to the mean over time. Absolutely the first thing any trader should do before making any trades is pull up a very long term chart and determine how far above or below the mean price is. You can then determine whether it’s likely for price to deliver a strong trending move.

regression mean
Like our new Facebook page to stay current on all things Smart Money Tracker

CHART OF THE DAY – Nasdaq and Biotech

Nasdaq and Biotech

There should be enough time in this daily cycle for the Nasdaq to complete a full test of the all-time highs at 5231 before the next drop down into a daily cycle low. Again, let me stress not to read anything into the impending correction. It’s just going to be a run of the mill correction. They tend to happen like clockwork about every 35-45 days.

For those clueless souls who assured me I was wrong about biotech, we have a very powerful bottoming pattern in play. Very similar to what happened in miners many months ago. The possible T-1 pattern target is around 305-310 before the biotech sector corrects along with the stock market. Then you will get another chance to buy. I suggest you don’t blow it a second time.

Nasdaq and Biotech
Like our new Facebook page to stay current on all things Smart Money Tracker