Strictly Necessary Cookie should be enabled at all times so that we can save your preferences for cookie settings.
If you disable this cookie, we will not be able to save your preferences. This means that every time you visit this website you will need to enable or disable cookies again.
Where is the PPT when we need them?
Way too early for the PPT. I don’t think they are going to be in any big hurry to intervene, if at all.
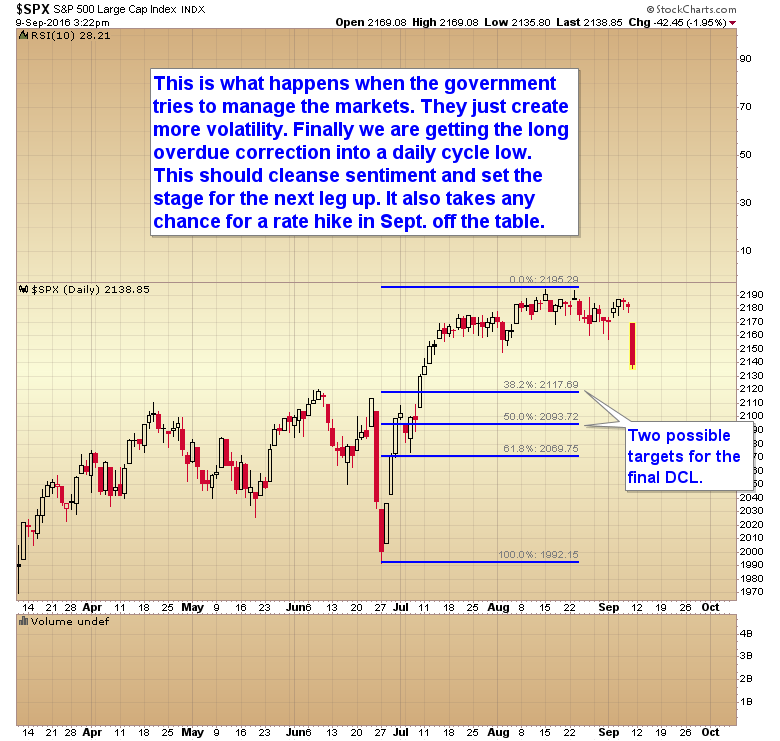
I think they propped the market up for too long and we finally got a sell off hard enough to overwhelm any intervention. They should just allow a normal and natural correction to progress. It will set the market up for the next rally.
Do you expect some kind of V-shape rally with new highs?
Absolutely we are going to new highs. This leg of the bull is just getting started.
This is just a normal run of the mill DCL.
If the PPT doesn’t come in and rescue the market , will that hurt billary’s chance of being elected president? I predict the Donald will be our next president if the PPT doesn’t intervene.
Hillary is constantly at fundraising parties – not for herself though – but for the PPT.
This will bottom sometime next week. Then the next leg up will begin.
A little different than I expected. I thought a correction would logically occur after the FOMC-meeting.
So the thesis is more that the DCL will cause the Fed not to raise interest rates, so the dollar will decline until end September/begin October, which could be bullish for e
A little different than I expected. I thought a correction would logically occur after the FOMC-meeting.
So the thesis is more that the DCL will cause the Fed not to raise interest rates, so the dollar will decline until end September/begin October, which should be bullish for equities, bonds, and commodities?
This also means limited upside until FOMC-meeting?
Thanks for the target ideas… I’m hoping we can go further down… It’s been such a drought for the bears.
If you look at weekly PPO indicator, there has been only 1 other instance when the HUI PPO got this high and turned down and that was in 2002.
At that time the following happened.
1) HUI went down 40% peak to trough, So for GDX that would be a sub $20 read.
2) It took more than a year to exceed that high, so we have more than 10 months to go regardless where we are in the “cycle”.
3) The HUI found support at the 200 Week moving average…..which is another 25% lower from here and fits with the $20 GDX target.
And here is the kicker….that advance was only 100% trough to peak. This one is more than 170%. All those looking for “buying opportunities” in Gold are going to look silly for the next year.
It has been an exciting 3 day bounce for short term traders. Just a bounce to relieve OS condition. $20-22 for gdx corresponds to 62% fib retrace and initial upthrust. On the weekly chart, price moved below a key moving average, which is beginning to decline. pms may not be the best place to be for a while. There could be occasional deceptive bounces on the way down. One can surmise that gold could undergo a commensurate decline over time. Price is king. At, times cycles may not work as expected. Senior golds nem, aem,etc. point in the same direction. Time will tell.
I’ll take the other side of that trade.
Miners are not going that low. We are starting a new bull market and just got stretched too far above the mean.
Sure we could form an undercut low next week as the selling panic reaches a climax but it isn’t going to take a year to move to new highs.
thats not saying much Gary.
A year is a very long time.
Everyone is looking for $20 – $22 GDX right now. Every chartist I follow has it as a target. I think we had the low last week judging by how the junior microcaps traded last week vs today. Can every chartist be right? Most have sold already and are waiting to re-enter at those targets.
Also, comparing any other bull market in the miners to today’s has to take into account the HUI to Gold ratio which was at all time extremes in Jan 2016. The ratio is well below the 2008 lows still! Oil is cheap and the miners have streamlined operations and are profitable for the most part.
http://www.macrotrends.net/1440/hui-to-gold-ratio
Here is a better HUI/Gold ratio chart.
https://staticseekingalpha.a.ssl.fastly.net/uploads/2016/9/8/45984866-1473370285790573_origin.png
Doesn’t look overbought to me!
Here is the article the ratio chart is from. Excellent read.
http://seekingalpha.com/article/4005128-gold-miners-bull-market-just-getting-started
The Gold HUI ratio is about as useless an indicator that you can use.
The companies have
1) Diluted their company value with debt
2) Diluted by giving stock options
3) Mined all the cheap gold out of the ground
Remember in 2003 all Gold companies were profitable at $400…now none will survive under $1,000.
Here is a link https://www.sprottmoney.com/blog/gold-undervalued-due-to-massive-stock-dilution-debt-steve-st-angelo.html
Lol, you link to an article by SRSrocco. I don’t think anyone has a worse track record than him. He is slagging on gold miners at the exact bottom!!! He should have been saying to buy these companies with both fists.
The three points you bring up are also somewhat useless. The first 2 can apply to any company in any industry and the third point is somewhat true and puts a floor on the gold price. None will survive under $1000 gold which is why gold isn’t going sub $1000.
I think you are missing the point.
1) If tomorrow every company doubles their debt load, would their equity be just as valuable at $1,330 gold? I think not. Hence the HUI gold ratio which ignores shares and debt outstanding is about as useful as Dennis Gartman’s comments.
2) Most other SPX companies have reduced their share count so all companies do not fall under that.
3) Your last point of Gold companies not surviving at sub $1,000 and hence Gold will never go below $1,000 is laughable. The total above ground dwarfs annual mine supply and that is only true for Gold compared to any other metal which is consumed. Total above ground Gold is equal to 50 years of annual mining. Compare that to oil which people say we are up to our eyeballs in with 60 DAYS of inventories.
I will buy a subscription if we exceed (more than 5%) the high in 6 months.
You give me a free one otherwise. Deal?
The first few days of next week will tell the story. If we are starting a bear market, the initial drop should be severe. A shallower sell off means Gary is right and it’s going higher. I keep an eye on margin debt and it peaked out in April of 2015 and is not anywhere near that peak right now. That is not a bullish sign.
Bear markets never start this way. They are sneaky and trap everyone into buying the dip.
This is how bull markets behave. They rally for a long time then drop sharply to scare the crap out of everyone.
That resets sentiment and then the next leg up can begin.
I guarantee there will be new highs this year.
Gary, your talking about sm and gold for new highs this year?
Have the FED interventions been all about saving the economy and the middle class or about saving the asses of the banks and stock holders? Rich America has had plenty of opportunity to unload their stocks at very favorable prices that would have not been possible without FED money printing, QE programs, low interest rates and market interventions. They have shown zero compassion for savers, retirees and pension funds. That all said, I expect that at some point, the FED will raise rates somewhat but will also stop supporting the market at every minor correction and allow it to decline in an orderly fashion although I suppose a crash might be part of their grand plan for control.
Pension funds will be left to deal with lower returns on their stock investments while still getting poor returns on their bonds. Pension payouts will be cut and the middle class will be further gutted. The privately owned FED will be fine with the mess because everyone will be calling for them to ‘save’ the pensioners and of course, the solution will be for the FED to buy stocks directly with freshly printed money. The BOJ is already well advanced with it’s goal of owning a controlling interest in Japan’s biggest corporations. It would be naive to think that cannot happen here .
Very good points Don. When the central banks of the world are the largest shareholders, something is definitely very wrong…Japan has become the model (since they are further down the road of activist interventions) and eventually the markets simply wither away from apathy…Looking at the recent behavior in US equity markets (i.e. 2 months stuck in a 2% range) tells me that our markets are well advanced in the sort of apathy/complacency of far too much intervention and/or implied support…When you have untold numbers of hedge funds simply shorting volatility into the abyss because of 7 years of Fed interventions and/or vol crushes, you know something is seriously wrong…Many days I simply see the tail wagging the dog with heavy handed vol selling which, in turn, compresses the ES range down to nothing…No fear, total complacency in “whatever it takes” type of rhetoric to buy a few more days, weeks, months or artificially inflated asset prices.
whenever we have so many looking down..
one year consolidation and all that..
usually means this scenario would not pan out
market seldom makes it so easy for the bulls
if it is so easy for majority to indicate 20$ GDX, they would all be retired by now with their precision and track record.
Noticed how strong some banks shares behaved during yesterdays meltdown in Indices. Markets will continue to have believe rates are getting higher, hence pressuring miners at least til fomc. So, next week further weakness for major miners GDX. Noticed it did not test the 200 ma. It is 26 ish now. Before fomc, see it at 22-23 ish. Thats when you buy!
Then, during the bounce, people of the bear camp will start proclaiming gdx making its right shoulder of HS. That the bounce from 22 to 26 is a right shoulder forming. Well, they could be right ONLY if we break the 22 neckline subsequently. Something that i doubt. So, when the rally resumes, those bear will say, right shoulder, followed by potential double top. Then when gdx makes a new high, they dare not buy anymore as prices are so extended again. Or they buy, only to cut losses during the next correction. lol
Bottomline, buy next week or the following during the scary drop.
Gary,
Seems 90% now there was a failed DCL in gold. We are gonna go down hard especially GDX, maybe 22 or lower. You must have changed your mind after today. I don’t think miners rally till end of year, gold finished
I don’t really understand how we could be in the window for the DCL in the stock indicies when, from my perspective at least, we were in the time window for the intermediate cycle high right into the first week of September…If anyone wants to take a look at the Nasdaq Composite and calculate the average dominant cycle length in the past year, they will find that the average cycle high to high has been 96 TD’s. Like clockwork, this market pivots off of swing highs right at that 96-100 TD time window…We just completed that this past week (9/2 to be exact)…IOW, a sharp breakdown out of a ledge right in the window of a probable cycle high seems to imply that we would be looking at early November for another very strong cycle low (like Feb, June).
The 96 TD cycle and the 33 TD cycle.
https://i.imgsafe.org/478563e3a5.png
95 TD cycle. Longer term chart.
https://i.imgsafe.org/47be945b56.png
Thx Vagabond, those are excellent charts…So I’m not the only one who sees the early Sept timeframe as the start of a probable decline into that early November trough.