Strictly Necessary Cookie should be enabled at all times so that we can save your preferences for cookie settings.
If you disable this cookie, we will not be able to save your preferences. This means that every time you visit this website you will need to enable or disable cookies again.
Gary, I agree that we are at a good buying spot right now and I have been rebuilding my trading shares over the past two days based on the same chart you are looking at. I am not 100% the ICL will be now or a month from now but this is close enough for me to start buying.
I am curious, however, why you were recommending buying GDX and perhaps NUGT earlier this week on Sunday and Monday in this post?
http://blog.smartmoneytrackerpremium.com/2016/10/metals-going-higher.html
Especially when Gold was flirting with its Yearly Cycle trend line and was due for a YCL based on TIME.
https://goldtadise.com/?p=383361
On Monday, in real time near noon PST, I posted that Gold’s shorter term Daily Cycle uptrend had broken and that I was doing the opposite and hedging with DUST (also had a ZSL hedge from earlier).
Point is, I do think that long and short term Cycle analysis and trend lines can be used to time your trades. I certainly don’t get all mine right (no one does) but if I had bought Monday morning, I would have bailed by noon based on the DUST and GOLD charts below.
On Dust:
https://goldtadise.com/?p=382839
On Gold:
https://goldtadise.com/?p=382876
Like I keep saying. Any long position will be a winner in a bull market. One doesn’t have to time perfect entries.
I was expecting the daily cycle to rally longer than 2 days. Most daily cycles even if they are going to be left translated will rally at least 6-8 days. I was expecting a false breakout and then the move down into the ICL.
I just got caught by an unusually short daily cycle top. But since the bull will eventually rescue all long positions I didn’t see any need to panic.
“Like I keep saying. Any long position will be a winner in a bull market. One doesn’t have to time perfect entries.” 3X leveraged funds might be exceptions to that rules, if timed badly enough.
Gary, I am struggling with your Daily Cycle count of 2 days over the last week?
I show gold currently on day 26 of its Trading / Daily Cycle and show that it broke my Trading or Daily Cycle uptrend on Monday, day 21 where it was overdue for a top. If you look at my chart I don’t see how you can not see the breakdown on Monday, day 21???
https://goldtadise.com/?p=382876
Surf, i’m nor sure why gary thought the last daily cycle should have been stronger than it was when the cycle before was left translated and had failed but I do think that NOT counting this as a second IC makes sense as otherwise it would be left translated and therfore this IC would fail- ie, go below 1200 and still be in a bear market? so we must still be in the first IC cycle.
so, if we are seeing THE yearly cycle low now, then maybe the next IC will be shorter, topping at the next fomc in december? bottoms feb/march?
2 days is the number of days gold rallied out of the last DCL. It’s very unusual for even a left translated cycle to only rally two days before topping.
eventually is a LONG time Gary…
But what if Gold is still in a Bear not a Bull market?
https://twitter.com/Fiberton/status/784280963048017920
Doesn’t seem likely at this point. Gold is making higher intermediate highs, has rallied above the 2015 yearly cycle high, turned the 100 week moving average back up, generated a gigantic 180% move in miners off the bottom, pushed the BPGDM to 100%, and both miners and silver have broken their bear market trend lines.
Gold is in a bull market in my opinion but Gold is now going to be in a bear market valued in CRB. Almost every other commodity will Outperform Gold. Think about it. Majority of people buy Gold as an inflation hedge. So far Gold has gone up but other commodities are languishing. Either Gold goes down as inflation has not arrived or other commodities catch up to Gold’s move up. Either way Gold stocks are in for rough times.
Hi,duck. you could be right. It is difficult to see oil making a huge move from here. Probably, it could get stuck for a while between 50 and 60. This may not be enough to hurt the gold miner profits a great deal. I could be wrong, though.
We will see a 14-18 ratio within 12 -15 months for Gold to Oil.
Pick any numbers you want to get that ratio. None look good for Gold Miners.
Well here’s the way I see it. Commodity bulls tend to unfold in two stages. The sectors that lead the first phase tend to underperform during the second phase and vice versa.
The first phase from 1999 to 2008 was led by energy and base metals as China and the emerging markets expanded rapidly.
The second phase should be driven by currency debasement as economies start to stagnate and governments turn to the printing press to fuel growth with more and more debt.
This means the metals and maybe AG should lead the second phase of the commodity bull. So while a ratio of 10-12 was normal during the first phase of the commodity bull it’s probably going to adjust higher as we enter the final 4-5 years leading to the final bubble phase.
No need to spend too much thought on this issue. Just run a relative strength chart and go with that sector which shows the best relative strength.
So the logic is that more printing press so PMs go up more? Why would anyone buy PMs if there was no inflation. It would be hard to get any serious inflation without Energy prices moving up a lot.
We will see what ratio we have in 12 months.
Good video. 2 Possibilities: 1. Gold was already at $1240. if it decides to continue its decline, we are about $40 away from $1200, which is 50% fib retrace. No big deal. I expect big money to jump in with both feet, should gold get there. 2. Alternatively, we could possibly get a tepid bounce to $1290 or so, which is not impossible. If so, it will likely be knocked down with fury to the 1200 level. It does not matter which scenario pans out. This is not the time to take foolish risks to pick up small change: small gains,but potentially large losses. Patience and discipline are the key.
You are a talented analyst. May be another 2 in your category. Nobody gets it right all the time. That is part of this business. You and your subscribers will do very well once golds finishes bottoming and takes off again to the target levels you indicated in your previous videos. Bottoming is not instantaneous. It takes time, backing and filling.
It is best to avoid NUGT/DUST until we get to know which of the above 2 outcomes pan out. All the best, cheers.
It is late enough in the intermediate cycle for this to be a final YCL without a retest. And first daily cycles more often than not recover all the previous ICL losses if the asset is in a bull market.
Gold and silver are not in bear markets! They are in bull markets that will last for several years. Gary is right, we need to think about this logically and look at the facts. The most important fact that convinces me that we’re in a bull market is the GSR Chart. Near the bottom of the bear market, GSR got close to 84 and then went down and broke through 80 and finally broke through the uptrend line. It got as low as 64 or lower, and then recently retraced up to about 73 and is now dropping down again on its way to 45 or lower. I suspect it could get to 16 or even lower because of all the government debt and the money printing that the Fed has done. The bottom line is: once the GSR breaks the uptrend line, it inexorably goes below 45 before the bull market tops and a bear market begins.
Perhaps true (I think we are in a Bull) but getting the timing right on the longer Intermediate Cycles is fairly important, IMO.
Over the past week, however, Gary was repeating almost daily that all the Gurus were calling for GDX to correct to the 19-22 level and that they were all wrong and only he was right.
oooopps…
True, I didn’t think everyone would be correct. Generally when everyone is thinking the same thing the market does the opposite. So I was expecting the daily cycle to rally at least 6-8 days before topping and turning down into the ICL. I got caught this time, it only rallied two days. The herd got it right. Most of the other cycles guys were calling for the same thing at the time. A 6-10 day rally. Of course none of these guys have an actual real time portfolio so they can conveniently ignore the fact they got it wrong also.
Sorry, cycles are not entirely reliable as stand alone indicators. They can be useful as background indicators.
Prior to this slide, you were insisting, based on your cycles, that gold would rise to 1390 plus before going into a decline. It did not happen.
So, many classical sell signals were kicked off on the charts , 3-4 days prior to the slide. I monitor about 100 key gold stocks. Right now, among these, there is not a single buy signal yet. I do not see the need to jump the gun. I trade only what I see.
All that I see now is silver getting a temporary reprieve at 200 ma in an OS condition. So, there could be a tepid bounce for several days to repair the OS condition followed by a lower low. Time will tell.
I will let folks who are more talented than myself to do the bottom fishing. I would not be surprised if there is a retest to a lower level to create a scare with a final flush. It may or may not happen. If it does, add to your positions. If it does not, smile and be proud about your foresight.
Markets are tricky. I expect to see some significant positive divergences before the bottoming process is complete. We are not there yet. Cheers.
Thanks Gary, I’m going fishing.
Let me know when you start buying…
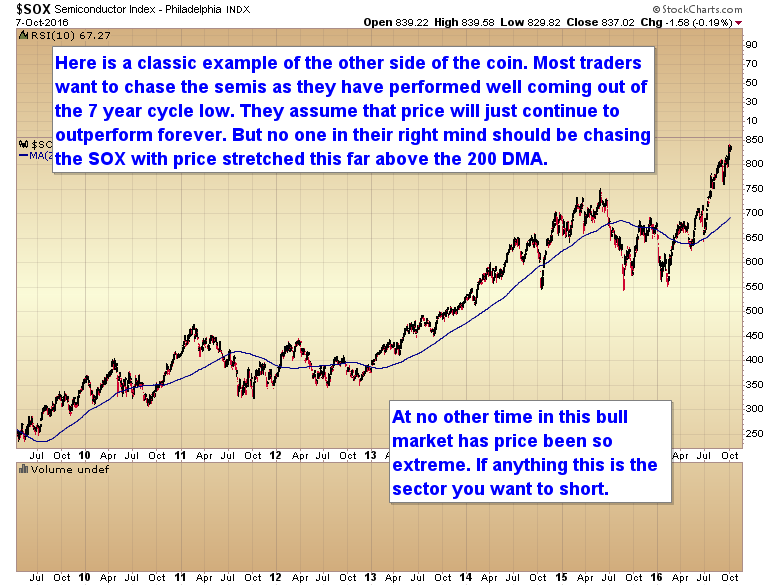
True, sox is stretched too far above 200 ma. We need to see a bit of loss of momentum and price to fall below a key ma. Talk of shorting right now is premature.
Edelson on Aug 10, 2016 http://www.moneyandmarkets.com/gold-crash-coming-80921
“gold should follow the path seen in the AI forecast chart above into a low in early October. That low should come in around $1,250 – $1,275.”
“Assuming that’s the course of action and major support holds, I’ll be screaming from the rooftops to buy gold, silver and select mining companies.”
Got to give Larry credit, he nailed this one perfectly.
Edelson on oil http://www.moneyandmarkets.com/sneak-peek-important-forecast-tool-use-81599
“How about crude oil?
Crude is following the model closely as well, and should decline a bit more into mid-September, then rally into the end of October, but then slide to new lows come February of next year.
“New lows” means below $26 a barrel. Put another way, the bear market in oil is not quite over yet!
Combined with the fact that the oil-and-energy sector is more indebted than ever, I wouldn’t get too bullish on energy stocks right now.”