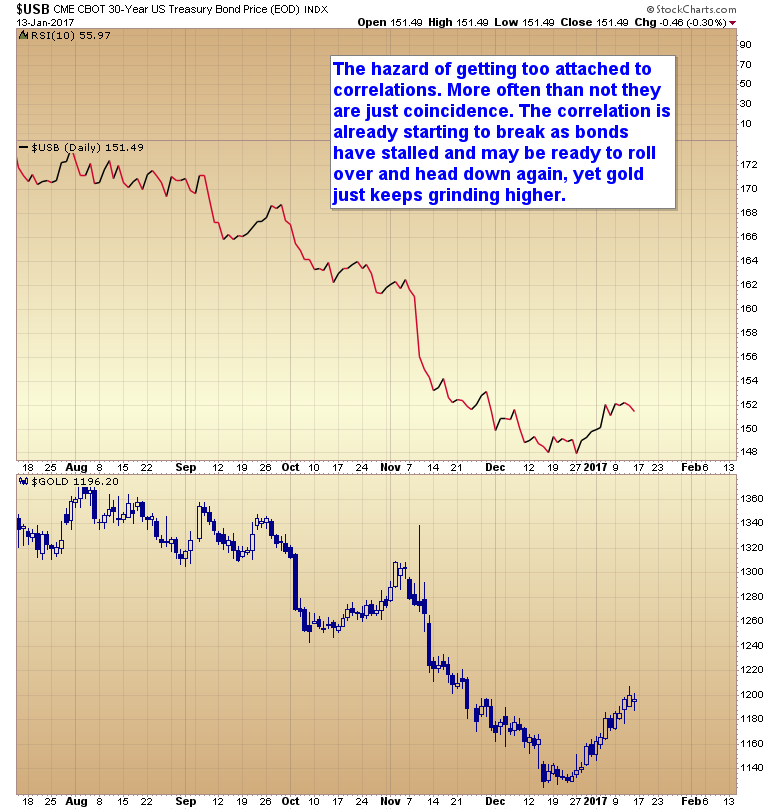
Bonds/Gold Correlation
Bonds have stalled and may be ready to roll over, yet gold just keeps grinding higher.
Like our new Facebook page to stay current on all things Smart Money Tracker
Bonds/Gold Correlation
Bonds have stalled and may be ready to roll over, yet gold just keeps grinding higher.
Like our new Facebook page to stay current on all things Smart Money Tracker
there is no break btw gold and treasuries – gold has been moved today by JPY’s meeting its half cycle high.
JPY + gold+ treasuries remain correlated risk-off assets and their correlation is enforced now that we are early in K-Spring.
Indeed, gold and treasuries will break at some point in the next years, just as it happened in midst of the last K-Spring, in the 1950s.
the bullish case for JPY (hence gold) is very strong since it is now in a major bear-market rally to last till May/June –> its fall to a HCL (rise of USDJPY) should be contained by 10dma and make a great buying opportunity.
Have a feeling we haven’t seen quite the last of K-Winter. 2020 maybe.
Steve, we are gonna get confirmation of the K-Spring having started on July 11, 2016 as treasuries will fall below December lows sometime this autumn –> i.e. after the ongoing bear market rally (of treasuries + JPY + gold) finishes in May/June and their decline resumes.
That lower low in autumn will prove risk-off assets are in multi-year decline.
Yes, we’d need to see that confirmation of Trsy yields later this year below the Dec. 2016 high to help know the season. I wonder/worry that the extraordinary measures taken since 2008 (artificial levitation of markets via gov’t intervention and credit creation) will force us to re-live some of the characteristics of the deflationary recession/depression that are characteristics of the winter and which we may not have fully endured due to said intervention. Long story short, have the economic policies of the past 8 years forced the winter phase to be prolonged? I think the jury is still out on that question. But thanks for your response.
ignore first sentence.
I would argue that the Kondratieff cycles are obsolete and have been ever since the world went off the gold standard. In a fiat world there is simply no amount of debt that can’t be printed away. This is why the last debt cycle also unfolded as inflationary in the 70’s instead of deflationary.
Theresa May’s speech tomorrow should make a great catalyst for retailers’ thrusting both-feet in stocks market’s swamp (commercials will use the opportunity to sell them).
I agree with Gary that the incoming YC decline will be very powerful (A Real Scorch 🙂 ) –> Russell2000 particularly stands as proof: its COT report cries with GARGANTOUS NET SHORTING BY COMMERCIALS! Way, way largest net shorting in more than 3 years! Even larger than before the last multi-year cycle decline.
The ensuing selling will be massive!
Alexanedru correct me if I am wrong but were you not the same person for calling a SM SCORCH to start 2 months ago and the SM went to all time highs, going up almost every day since you called the top back then? Ya, I thought so…
Keep up the good work Alex!! Very insightful comments.
Are you short GBPUSD?
@wallstreetjesus
think he was short at 1.22 and closed for a 2 cent profit
@alexandru
good call on gbp, you are very adept at spotting currency trends (and this is coming from a currency trader of more than 7 years.) Btw, what is your take on gold? I am expecting it to fill the gaps below; methinks it should hit a minimum of 1159 for the DCL.
Thank you, WSJ!
Thank you, Terry!
I am a novice trader in FX – I’ve stayed out of currency trading, I have followed them for years but I was spooked by their volatility, so that it is for just a short time that I’ve thrust myself into their realm.
I was short GBP from 1.222 down to 1.208 when I got stopped out –> I expect GBP to move further South for some time but I obey my stop.
Gold’s retracement (just like JPY’s) should be limited – a retracement with a shakeout of its 10dma and thrusting up again [abreast with Treasuries, Gary 🙂 ].
The past week has been a nerve-wracking one in the gold (NYSEARCA:GLD) market, as both bulls and bears awaited the inevitable $1,200/oz test. The bulls managed to keep gold above $1,200/oz for nearly 12 hours Thursday, but the bears held their ground and managed to suppress the metal by the close. Looking at comments and general sentiment this week, most are convinced this was a losing week for the bulls. If I had not looked at charts and had simply read comments sections on Seeking Alpha, I would have assumed gold was down 2% for the week. Despite gold closing higher between Wednesday and Friday, rising from $1,195.60 to $1,197.30, bullish sentiment plunged from 37% bulls to 29% bulls. This is quite rare, and I’m having a difficult time finding an occurrence as extreme as this in any market.
Moving onto the Gold Miners Index (NYSEARCA:GDX), the bears are currently on very thin ice. The GDX broke out above its descending channel on January 5th, and we’ve been basing above here since. Despite the bears being very loud in the comments section, I do not know what their plan is here. Originally, they were shorting against $22.50 as this was resistance (which was not a bad idea), but I believe they’ve turned stubborn and do not have a trade plan anymore. The fact that the GDX continues to find support at its descending channel is not a good sign for the bears, and I don’t see any resistance above until $24.80 for the GDX. If the $24.80-$25.00 resistance breaks, it’s game over and the lone stubborn bear pictured above will be swimming with the bulls. I believe the bulls have the upper hand on the GDX, and I don’t see many outs for the bears. Barring a 3% drop in the price of gold to $1,165 or less, I see the GDX holding $21.00 where those that have been missed this rally would like come in to start positions.
Some of my favourite writers remain bearish on the gold miners and think a collapse is imminent here. Meanwhile, bullish sentiment is still in depressed territory, and the technicals improve each week for gold and the miners. I believe that when the trend changes, so should the trader, but some would rather be ‘right’ than make money. As one of my favourite traders Ed Seykota once said, “It can be very expensive to convince the markets that you are right”.
Above is from an article: http://seekingalpha.com/article/4036875-gold-bulls-vacation-fear-pounding
I think these are good signs on the bearishness that might just keep the feul with least correction..who knows. Looking at 2009-2011 bull we might be a look at better DC cycles acceleration before correction after the correction (YCL) it started with.
https://www.tradingview.com/x/fMj6eKtY/
You will find this graph of Deutch bank very interesting! Net spec in treasury futures as a percentage of open interest in units of standard deviation since 1996. It clearly seem to be a front runner as an indicator for a market crash if it is at the lowest point. It is at the lowest point on the graph and accelerating. With all major instruments at extreme turning points we have fireworks ahead for the year in my opinion.
http://www.zerohedge.com/sites/default/files/images/user5/imageroot/2017/01/01/net%20short%20std%20dev_0.jpg
That is the same chart I posted two days ago, ARends. It is that chart and comments I wrote that motivated Gary to put up today’s post denying a correlation between gold and bonds and adding that it is probably just a coincidence and that the correlation is about to break.
Completely wrong of course. Even the chart above shows a fairly obvious existing and ongoing correlation. If anything it is predictive since gold appears to lead so the slight uptick in gold prices suggest bonds will follow and not turn down as Gary is asserting.
Especially given the negative sentiment on bonds and severe short positioning. That kind of set-up just begs for a rebound that will hand the shorts their arses on a platter. Because when everyone is on one side of the trade it means all of them will be wrong.
Anyway, I have a helpful article on the subject since this current period of correlation is already several years old and hardly a coincidence after this much time has passed. This article from ZeroHedge shows five distinct periods during the last 50 odd years where gold/rates were (and were not) in sync. Keep in mind that this is a chart of Treasury yields versus gold and not bond prices versus gold. I am sure you will figure the rest out from there.
http://www.zerohedge.com/news/message-gold-and-treasuries-time-different
I am going to offer a little evidence that bonds and gold are still correlated as a follow up to the prior post and show that bonds are still in a bull. Here is what you need to do; Bring up a monthly chart of the 30 year bond and plot a pair of lines creating an upper and lower channel beginning back in 2002 (for the upper rail).
Now using that upper rail as the guide you can identify what the lower rail should be.
It is perfectly aligned with the upper rail so that is excellent news from a chart perspective. When you have done that you can see very clearly that the 30 year is still in a bull market within its rising channel and secondly that it has just recently touched the lower rail, put in a nice reversal candle and bounced.
In other words, bonds are about to move higher again towards the upper channel line.
And that tells us implicitly (if not emphatically) that gold is going to rise from here.
So that was our buy signal on gold. And unless we see a breakdown on the 30 year I will stay long because it is my belief the gold/bonds correlation is still valid.
Yes, big rally coming in bonds. Lots of money about to change hands.
Are you mocking as usual or do you actually agree?
Come on now you know better than that. We all like to have a little fun. Free entertainment here 🙂 The commercial traders are at all time extremes long the 5, 10 & 30 year bonds. Everyone is on the other side of this trade. We are not getting much of a pullback in gold around $1,200 which bodes well for the metals. Lots of people are waiting for a pullback that probably won’t come.
I absolutely agree bonds will rally along with gold. Probably going to be a sizeable rally with so many on the other side of the trade.
Its the media that’s the problem. All they talked about is how bad stocks would tank if Trump got in and how gold was going to the moon. How many people lost money on that call. Now they got everyone short bonds saying the 30 year bond rally is over. This will not end well for those folks either in my opinion.
There is a sizeable bond rally coming. Who knows when or what will trigger it but it is coming.
WallStreetJesus
Thank you for an excellent post. I fully agree that gold is headed up at this juncture and that CANNOT happen if 10years yield was headed north in any meaningful way.
Additionally, significantly higher yields at this juncture will create havoc with the economy which MHO ain’t doing that well anyway. And, that is nonono.
OK cool. Thanks Jesus.
For anyone under the illusion that the dollar is a strong currency, just look at the chart below of the US$ against the Swiss Franc. During my working life, I have seen the dollar fall 76% against the Swiss. Hardly the sign of a strong currency. It now looks like the next leg down of the dollar is imminent. Against the Swiss, I would expect another 50% fall of the dollar to 0.50. That doesn’t mean that I believe that the Swiss Franc will be a strong currency. But I do see a collapse of the US dollar until it reaches its intrinsic value of ZERO or just above.
https://goldswitzerland.com/2017-spectacular-for-gold-and-silver-but-disaster-for-bonds-and-stocks/
Are you guys not paying attention? Gary has said that the bond bubble has burst. That can only mean one thing.
Exactly Don. And yes we get it. Should the bond bubble burst it means gold is heading into the toilet for the next decade. That is if the existing correlation were to hold of course. It means anyone long metals or holding Old Turkey could lose an insane amount of money in the next while.
Fortunately though correlations don’t hold forever and even this one will have its day and reverse as the Zerohedge article I posted above points out. If you read the article they showed 5 distinct periods where gold was either in a positive or negative correlation to bond yields since the 1970’s.
The problem is we don’t know when a correlation will break. This one is particularly strong right now as well. Hell, the 2016 chart of the 30 year looks almost identical to the gold chart. It takes a real fool to fight the tape on these relationships though.
Anyone trading today who is either ignorant of correlations or willfully blind to their importance is a person whose account is going to get demolished because they don’t take these important cross asset relationships into account or cannot understand them.
Computer based trading revolves around asset correlations though. The Algo’s are set to instantly take advantage of opportunities created when one class leads another. And as we know most trading is automated these days so we absolutely must pay attention. In our case gold leads so bonds are a buy. So is Yen/dollars.
“Exactly Don. And yes we get it. Should the bond bubble burst it means gold is heading into the toilet for the next decade.” …. I couldn’t agree more. Though I would add that it is true only in dollar terms. And, paper gold would probably be wiped out for ever. But, those holding the real stuff would probably do all right.
Just a quick follow up to my comments and trade from last week. I did hold my 3X longs as noted already because I read the gold charts based on the hourly as working its way higher within the trend channel and was expecting to see a break above 1210 on Monday.
We now have seen the 1210 number breached and gone higher so this is a hold until the top of the hourly chart channel is reached. 1217 is within reach today though. A channel reversal is expected to follow then and I may take a brief short position at that time depending on how gold behaves next.
My trade was based on Yen and the 30 year charts expectations and the gold channel. It was the correct way to read gold this time around. The setup remains very positive. Especially as bonds should now break higher and perhaps it will be Trumps inauguration day that confirms that important reversal in trend that has already begun.
Should Theresa May’s speech produce a rally and RUSSELL2000 touches 1346 instead, I’ll go short the stock market anew.
PS: DAX has produced a weekly swing high.
… NOT produce …
gold is up,
Way up. That’s 22 dollars so far and still moving. It has exceeded my 1217 target. I am buying again today. I can hardly believe I doubted myself last Friday when I turned bullish late day but it will pay off nicely and its time to add more miners.
And damn the torpedoes.
short GBPUSD @ 1.222 [again at the same level]
and got stopped out 🙂
Good morning.
Pedestrian,
So you think it is a good spot today to add more shares?
Dday
We have not heard too much from you recently. How is the crystal ball, is it clear as to go ahead?
That depends on your time frame Goild. I have a proprietary indicator telling me to sell early this morning and prepare for a pullback. It’s not always right though so I need to just take the pulse during early trading. My impression a little earlier in the morning was that a breakout was in progress but I have since had a little cold water thrown at me. Its kind of just wait and see. I will make money no matter what happens though. Just depends on how much by timing.
With gold being +1.3% and USD -1% one can expect the 3X miners to go well beyond 10% especially since in the last session they have been lagging.
Or is that this year gold and miners will invert: very bullish for gold but no so much for miners?
Let us not forget the horrible one day -2%-3% down spikes of previous years.
Don’t get too excited about gold and the miners here. Gary told everyone 2 days ago that the initial thrust is over.
That was our cue to buy more.
That is when I bought gdxj. When inquired Gary said there is some money to be made albeit at lower rate.
Looking at gold uprising it appears to be in a straight line. So the big institutions might be buying it on schedule. I just bought 2K shares at $10.35 as I think I will get some easy $400.
Oh, I made a mistake. Placed an order to sell NUGT at $10.45 when I meant $10.55 and so I only got $200.00.
Wash for execution errors!
In going down the rule of thumb in bad days is that the 3X miners will fall about 2X the low of the pre-session, plus an extremist factor.
Conversely, in good days, the 3X miners might go 2X the pre-session high plus an extremist factor.
Being a Tuesday, and not a Monday, it may happen that NUGT will go above $11.
Hi Goild, I bought NUGT at $6.79, weekly gold looks good so just sitting tight. Hope that answers your query…
Dday,
I am glad you got a good price and that you are on board!!
Thanks,
Yea above $1208 gold should have some legs. I would like to see a decent weekly close……
Brexit and Trump helping gold, today anyway…
Did Trump convey to the Jack Lew at the Treasury ESF to cease the suppression of the gold and silver futures markets and ensure those markets are free trading markets?
We may be witnessing this.
We still need to be careful. GLD volume has not taken off.
Probably after the SM starts to fall. The rise today comes probably from Asia and Europe trading.
Maybe it’s possible trade wars or trade confrontations that Trump will have with China, Mexico and other countries that has the markets reacting this way so far.
I was wrong, they are taking PMs down during U.S. hours as usual.
The USD is due for a near term DCL but out of its DCL, I expect the next Daily Cycle to top quickly and roll over into its next Intermediate Cycle Low.
On GDX, I like the price action on day 17 of this first Trading Cycle out of the Yearly Cycle Low in December.
https://surfcity.co/2017/01/17/gold-and-gdx-cycle-update/
10years yield is down>>>>>>>>>gold is up
10years yield is down>>>>>>>>>dollar is down
As simple as that.
The dilemma for those in power: raise or not to raise short-term and over-night rates!