Strictly Necessary Cookie should be enabled at all times so that we can save your preferences for cookie settings.
If you disable this cookie, we will not be able to save your preferences. This means that every time you visit this website you will need to enable or disable cookies again.
I got back into SQQQ this morning at 32.48. I think we have some serious downside coming for Apple and the tech stocks in general. I am already up a little and moving in the right direction.
I guess my concern is that the bounce may turn out to be more than just temporary strength. I already have a stake in a Canadian gold junior (ZJG) and it is moving up but still below my break even price. I also have some silver positions that are under water and a long way from being profitable. If this bounce is going to fail, then I should be selling, that is, if Gary is right. But what if he is wrong and everyone is left ‘watching’?
Good luck Bigdaddy. The Trump bullish effect should be on it’s last legs and the tech stocks are due for a fall so maybe you will be on the right side for a change. That said, with the central banks throwing free money at the markets, there is no telling how high they will bid up their favorite five stocks. They don’t seem to care about price and why would they when they can create money as freely as they wish?
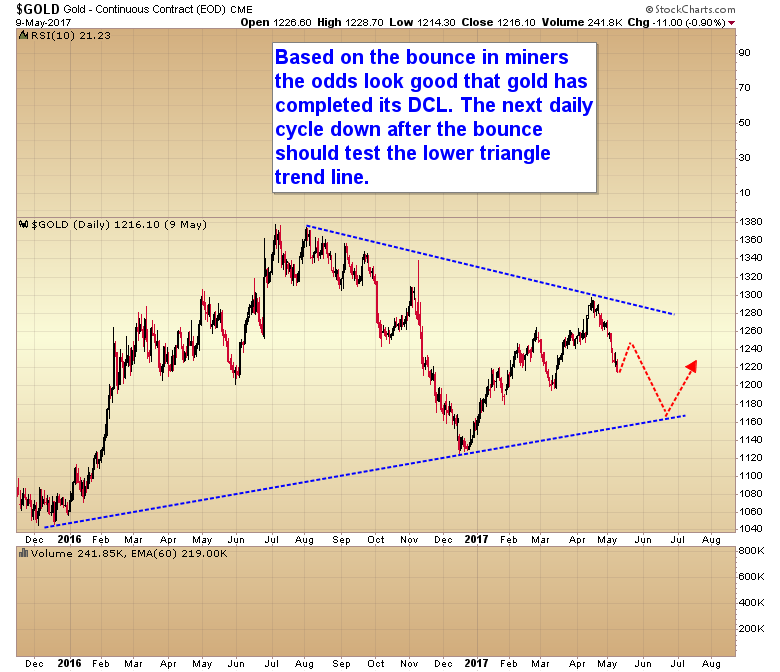
So false reversal or DCL which is it?
Watch the Miners.. What are they telling you?
Not telling me much, other than a small bounce just like gold….
A swing low with upside momentum is *usually indicative of a short term trend change.
*Usually.. meaning no promises 😉
. Shorting the stock market is a bad bet. Even the tiniest sell off is reversed quickly.
I told you Gary.. Miners often precede Gold by a hair. The drop into this DCL and today’s reversal in the Miners is/are a prime example 😉
Can’t wait to get back into DUST for the final drop into this YCL, but I do think the Market will want to throw us a curve ball. It is also worth noting that Gold bottomed during the last 3 rate hikes, and June is primed for a hike according to the Fed watch tool (currently @87%).
Gary didn’t draw that bounce in very high.🙁
Metals look better today, upside accumulation, must be that full moon.
Lovely full moon 🙂
All – this looks to me like it could be a DCL in oil. I mentioned it to Gary when I saw the swing high on Monday but he’s only getting back in today I believe. Let’s see how far up this goes – perhaps it’ll go further than your $49 prediction Alex?
Let the bounce play out over time, instead of going continuously through the predicting/retracting cycle. When the mom begins to fade, it is time to exit.
ras – what do you use to determine when momentum is fading? are you buying this bounce?
Hi, Blue. Intra day charts. We may get another opportunity after a dip in a couple of days. This is just a bounce, but worth pursuing with caution.
Long time T/A user, relatively new to cycles. One thing I strongly agree with – when weekly slo sto is in single digits with its second derivative clearly positive, combined with horrendous sentiment, I become a bargain hunter.
Maybe it will take till the second half of June to get there, maybe sooner. But I agree with Gary that Surf might be a bit premature in his scenario A due to nondescript sentiment.
It looks like EWI is on the same page as Gary. Expect lower prices to come for silver and gold. However, that may be a contrarian indicator. 😎
Chris Vermuelen is also bearish on gold and so is Larry Williams.
Sitting on a dslv position I took yesterday @29.77. Todays PM “bounce” is weak to say the least. My target is silver testing 15.85. Hopefully I can catch a jdst position before then.
KHT – I think you might have gotten in at the local high for DSLV – it’s looking like it’s going to start coming down at least for a few days before it resumes up. For a longer term hold, it should be fine.
Gotcha bluelagoon, but gold still looks weak and until silver turns the corner i`ll stay with the trend. I know silver is oversold and no matter how oversold it is it can get oversolder. I think something is going on with the PMs and I don`t think 16 is the near term bottom.
OIl!
USDJPY could be double topping? A drop is going to be rocket fuel, especially if we get some SM pullback to match.
Gary, you have to keep an open mind that a turn and upside move combined with a combo of other potential market moves could just push up to challenge that down trend line again? I know it is not likely from what you are saying, but that is still a possibility.
Metals are looking pathetic and now miners don’t care.
If metals give us any sort of significant move up, things are ready to pop. Who knows if it will be a one week bounce and roll over or the start of a bigger run.
I am open to both as possibilities, especially based on PED and his analysis of complicit markets and set ups.
https://www.kimblechartingsolutions.com/wp-content/uploads/2017/05/vix-index-testing-2007-levels-dual-support-may-10.jpg
Just a word of caution. GLD is not acting like a DCL has formed. How many times have we seen the banksters manufacture a false rally to sucker in gold bugs prematurely only to pull the rug out from under them with another leg down?
I’ll say it again: going long on a third or fourth daily cycle is dangerous.
Even if it hasnt just look on miners. The downside is prbly limited. I doubt gold breaks 1200
Sold my SQQQ at the close for a small loss. No fireworks today. Let’s see what tomorrow brings.
Never mind Gold, all in on bitcoin!
i don`t think we are in a bull market ToTo.
https://invst.ly/3xkpj
Precisely KHT. I have made the same comment here a hundred times referencing the exact same chart (except I never actually draw the charts since I can’t be bothered). Almost nobody here will listen though. But the upper channel is pretty convincing since it amounts to a 6 year cap on the gold price and every year the price can only be lower since the line is descending. Gold has never once broken to the topside of that upper rail yet. Until it does this is unequivocally a bear and surprises will be to the downside.
Since you are a good chart artist maybe you can convince Gary.
BTW, I am sure you noticed there is a problem with the bottom rail on your chart diagram. I would have drawn that differently. Gold is actually falling into a narrowing wedge. Try that instead and you will get a better idea of the terminus. But try not to scare anyone. Some people on this site just can’t handle the facts.
Gary, you really need to look closely at that chart that KHT has made. You have been calling this market a bull since December of 2015 and all that bull market of yours has achieved since then is to confirm the upper channel boundary.
This is still a BEAR MARKET for cripes sake!!! All your people need to click on the link above.
How can you not see the problem with your analysis when its staring you right in the face so obviously? Don’t you ever wonder why your price and trend expectations are being frustrated again and again? And lastly, what is it going to take before you do a little reassessment of your position?
Maybe I should have drawn this chart myself back when I first began talking about it in 2016. At that time, when we failed at resistance I knew gold was doomed for another cycle down and warned everyone here to get out of its way.
And I was 100% correct.
When we failed at resistance again in April I repeated the warning and just the other day I pointed out that the two peaks in 2016 and 2017 amount to little more than a double top along a falling channel line.
In other words, a VERY left translated double top. Not so unlike the pair of peaks that we saw back in 2011 and 2012 and we all know how that turned out when gold crashed in 2013 (its right on the chart man. Just take a look).
So forget all that nonsense about higher-highs and higher lows. You are using a shorter term chart that has no perspective. To get the whole picture you need a monthly just as KHT has used and then it all becomes crystal clear.
People…..study this chart!
Maybe you don’t understand.
I use different tools than you do. My tools will spot the beginning of a bull market long before yours give you confirmation.
Your channels will have a very long lag time before signalling a new bull market.
Mine will tell me it’s a new bull market very soon after it has begun, and many months before a channel breakout and you get confirmation.
Gary, that makes no sense. If that exact same chart above was an hourly (instead of a monthly) and you were a day-trader I can absolutely guarantee you would not be trading it with a bullish bias until it gave a signal that it was breaking out of the channel or marking a clear bottom.
Your system does not work because those kinds of systems never work successfully. All you divined by reading sentiment indicators was that the majority were on the wrong side of the trade betting on a new bull market. Most people left their gains on the table and rode that so-called bull right back to the bottom and have been kicking themselves ever since.
They saw fantastic profits and then let it all slip away.
I guess since my system doesn’t work then I was only imagining calling the bottom in Dec. when everyone else was bearish, and all the profits we made from that two month rally are also imaginary.
And since my system doesn’t work I guess I was just imagining calling the top almost to the day 3 weeks ago when you were looking for a rally to 1320. And again all the profits we’ve made on the short side are imaginary.
There’s more than just sentiment to calling the final bear market low. A bear market low has to occur at a yearly cycle low. One of those occurred in December of 2015. A bear market low also has to occur at an 8 year cycle low (the last one came in 2008). That next one was due between 2015 and 2017 (they can stretch or shrink a bit).
The reason I think the 8 YCL low occurred a little early is because the CRB was due for a 3 YCL in 2016 and it’s unlikely that the multi year gold cycle would stretch a year or more past the CRB cycle. So the odds are very high that gold’s 8 YCL occurred in December of 2015.
So unless the bear market is going to stretch out another entire 8 year cycle (not likely) then it had to have occurred in December of 2015.
There’s more than one way to skin a cat and there’s certainly better ways to call a bear market bottom than waiting months or even years for a channel breakout. That kind of signal has way too much lag to be of much use.
Gary — You are wasting your time with this goofball. He’s as dense as a London fog Lol 😊
You know what KHT?
You should scare the crap out of the bugs and draw that lower channel on your chart. It projects down to around 825 sometime in 2019 which seems about right to me since that’s about when this exceptional bull market in equities will likely end if you listen to M. Armstrong.
Around that time we all need to be the hell out of public debt of all kinds, most real estate and even the stock market since the wheels are going to come off the wagon with an epic sovereign default cycle which will be extraordinarily deflationary.
And we should be so thoroughly disenchanted with governments at all levels and disgusted by all the losses we are taking in traditional investments by then that we are ready to hold physical precious metals again as a last resort to all the deprivations, confiscation and heavy taxation.
Marty always said the real purpose of gold was in response to the greed of governments and lost confidence in the system. When the real shit-show starts our pensions will be evaporating and everyone unprepared will be forced to live on tiny hand-outs and stipends which will represent the last fragments of our retirement dreams.
Banks, insurance and pension companies will all be going tits-up when that happens.
When the old Soviet Union collapsed so did all their retirement schemes. Few know about that harsh period in history but the internal defaults against the general public were exceptionally painful. Pension benefits dropped as low as 20 bucks a month and the economy went into a serious depression as the empire simply ran out of money and everything ground to a halt.
Nobody believes that will happen in the West. And yet we all accept that the debt burden carried in the developed market countries is equally unsustainable and can never be paid. Well if it can’t be paid then that means just one of two things.
Either we enter a depression that is extremely serious as capital withers and asset values plummet or two, we are faced with a period of inflation so extreme that nobody can really tell the difference between that event and an actual depression.
Lets be honest, what is really the difference between having a pocket filled with lint instead of cash and one that is bursting to the seams with money you can’t buy a cheap pack of smokes with? Whether inflation or deflation, the feeling is the same….we will all be a lot poorer when the chickens finally come home to roost.
On a positive note, real money will have a place again. But sadly it will be during a period of hardship such that most here will hardly be able to enjoy the benefits. So go ahead, draw that lower rail on your chart so everyone can see where we are really heading with gold in the next couple years.
And remember, in a bear market surprise are to the downside!
This one you mean?
https://invst.ly/3xmlg
That’s it! Thank you very much. A picture is a thousand words.
Once again, neither trendline on Gary’s chart is sacrosanct.
Both are likely to go the way of the pie crust 😉
First the lower one; then the upper one.
Though the upper one gets my vote for
Most Likely to Get Broken.
And once again, when the top line breaks, it certainly does not mean the end of the bear market in gold. Rather, it confirms the December, 2015, low as a cycle degree low. So, sure, it will confirm the end of the cycle degree move down in gold, 2011-2015, but it will not confirm the end of the larger supercycle move down in gold.
Steffmeister,
The above is just one illustration of how I use fractals.
There are ZERO fractals on the human body.
TONS of fibonacci relationships all over the place,
But not a single fractal anywhere in…
…sight?
Gary,
“So unless the bear market is going to stretch out another entire 8 year cycle (not likely) then it had to have occurred in December of 2015.”
Very, very likely that the bear market stretches out another entire 8 year cycle.
My question is: Why do you doubt your own intuition?
I’m going to cover why that’s unlikely in my next video which will be posted in a few minutes.
Gary and Pedestrian,
I’m gonna have to thank both of you guys again, this time thanks for the insistence on those trendlines which are fated to be broken.
You think you’re arguing, but you’re not even arguing. Being an Economist (on the one hand… on the other hand…), I play out BOTH of your “arguments” SIMULTANEOUSLY in my mind, but in the ABSENCE of attack and defend strategies, which are interpersonal and largely ignored by the market.
(Hint: The power of paradox!… close kin to intuition.)
SUPERCYCLE degree bear market: 2011 until sometime in the mid-2020s. BEAR market still in progress.
CYCLE degree bear market: 2011-2015. Past bear market, one degree smaller than the above.
CYCLE degree rally: 2015 until around 2019 or 2020. RALLY still in progress. Likely triangle or some sort of flat correction (multi-year consolidation).
CYCLE degree final bear: 2019/20 until sometime in the mid-2020s. Future bear market, within an even larger bear market — scary — think 2013!
At any rate, you’ve caused me to re-evaluate my settings for analysis at the cycle degree of trend, such that all key inflection points make mathematical sense: April & June, 2013; March, July, and December, 2015; July, 2016.
Of course, in that context the December, 2016, low does NOT make sense. That’s because it’s one degree lower. The PRIMARY (Yearly) move down since July, 2016 appears as an INCOMPLETE double zig zag.
PRIMARY wave B target using new settings: Around 1075-80, for now, though I don’t see it changing too much in the coming months.