Strictly Necessary Cookie should be enabled at all times so that we can save your preferences for cookie settings.
If you disable this cookie, we will not be able to save your preferences. This means that every time you visit this website you will need to enable or disable cookies again.
YES.
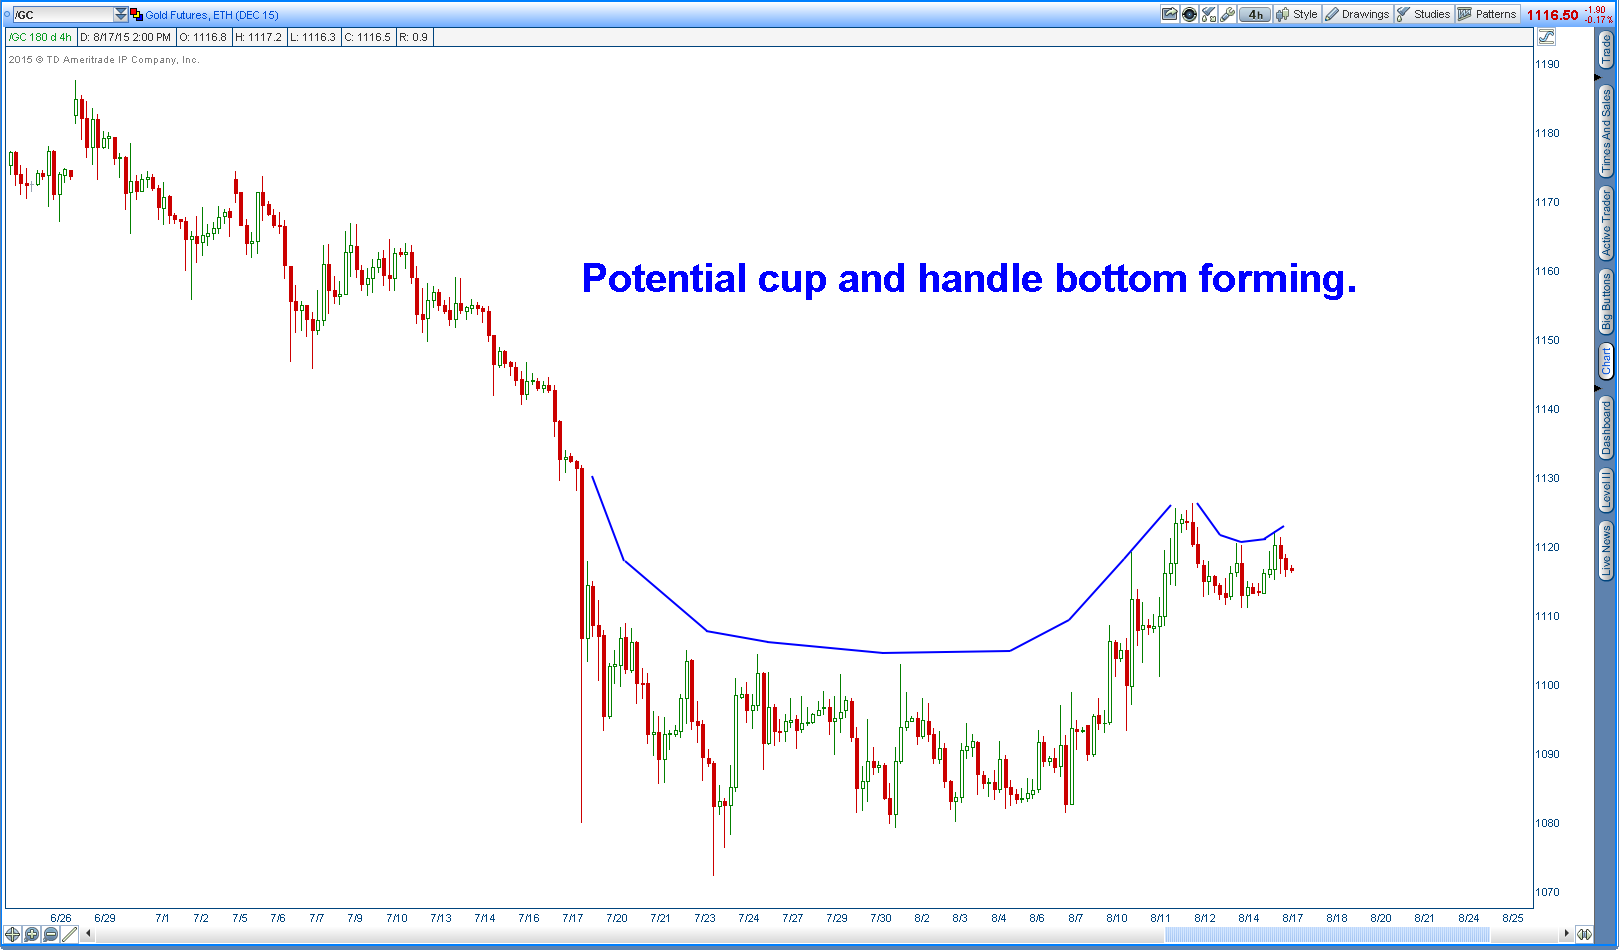
Now if Gold can close above $1226 it will break a trend line and make a higher high for the first time in years.
http://schrts.co/9i80RM
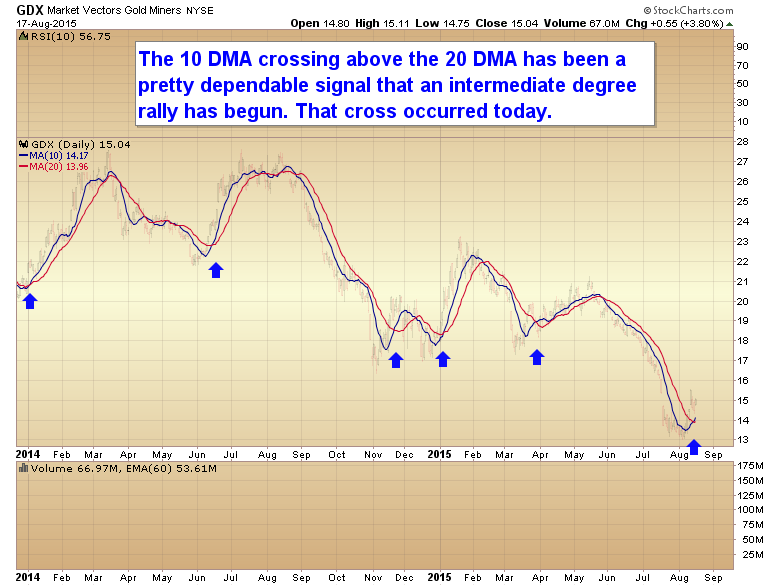
I recommend comparing like things — a strong move down should be compared with another strong move down:
I see the 10 SMA cross above the 20 SMA on March 25, May 8, and June 4, 2013. In my opinion, only the later two dates were during an intermediate degree rally — an anemic sideways consolidation period which saw the 10 SMA cross above, then below, then back above the 20 SMA, before finally turning down.
I happen to be long GDX at present, but only in the short run, unless 1162 gold is taken out. Miners have a long way to go before they get to that point, so I’ll be looking at other indicators (the ones I posted on Aug 9) to indicate a good exit point.
http://www.barchart.com/chart.php?sym=GDX&style=technical&template=&p=DO&d=O&sd=09%2F19%2F2012&ed=06%2F27%2F2013&size=L&log=0&t=CANDLE&v=0&evnt=1&late=1&o1=&o2=&o3=&sh=100&indicators=SMA%2810%2C%29%3BSMA%2820%2C%29&chartindicator_6_code=SMA&chartindicator_6_param_0=10&chartindicator_6_param_1=&chartindicator_7_code=SMA&chartindicator_7_param_0=20&chartindicator_7_param_1=&addindicator=&submitted=1&fpage=&txtDate=04%2F10%2F2013#jump
You are comparing the recognition phase of the bear market to the exhaustion phase. Those are two different market environments, and the strategies that worked in one won’t work in the other. Traders need to adapt to different market environments and not let recency bias control their emotions.
Looking like more weakness in this sector to come.
The gold and silver smashes (and don’t forget ES futures interventions) will continue until morale improves.
The charts are looking more and more like I said they would here:
http://blog.smartmoneytrackerpremium.com/2015/08/chart-of-trhe-day.html
Regarding exhaustion, at some point one needs to address the mammoth in the room:
The 70’s featured a decade of strong advance — stronger than the 2000s — followed by two decades of correction. Then the 2000s featured another strong advance for about a decade. Combine that with the fact that CPI is up ~24X since 1913, whereas gold is up ~54X in the same time frame, gold has substantially outpaced the CPI, whereas it should mark it, across centuries, and across all markets around the world. When that happens, the move down will become exhausted — that may take another 10-15 years.
Even if you don’t agree with the mammoth in the room assessment, you can’t discard it, either, until it’s invalidated by price action over time.
That’s my concern…the mammoth could easily crush/kill/destroy the accounts of those who ignore it.
I think that was the largest attack on the metals yet. Almost 20,000 contracts over a 45 minute period, mostly in the premarket. They are probably trying to set up another attack on tomorrows FOMC minutes. Here’s hoping it backfires and they lose millions.
With oil plummeting and soon in the 30s, where can gold really go?? 1130 seems for now to be the cap for this “fake” rally.
Oil Plummeting almost 5%.
Fed says today in minutes that they are just about ready to raise rates.
Stocks down.
Then Gold goes UP?? It just doesn’t make ANY Sense.