Regression Mean
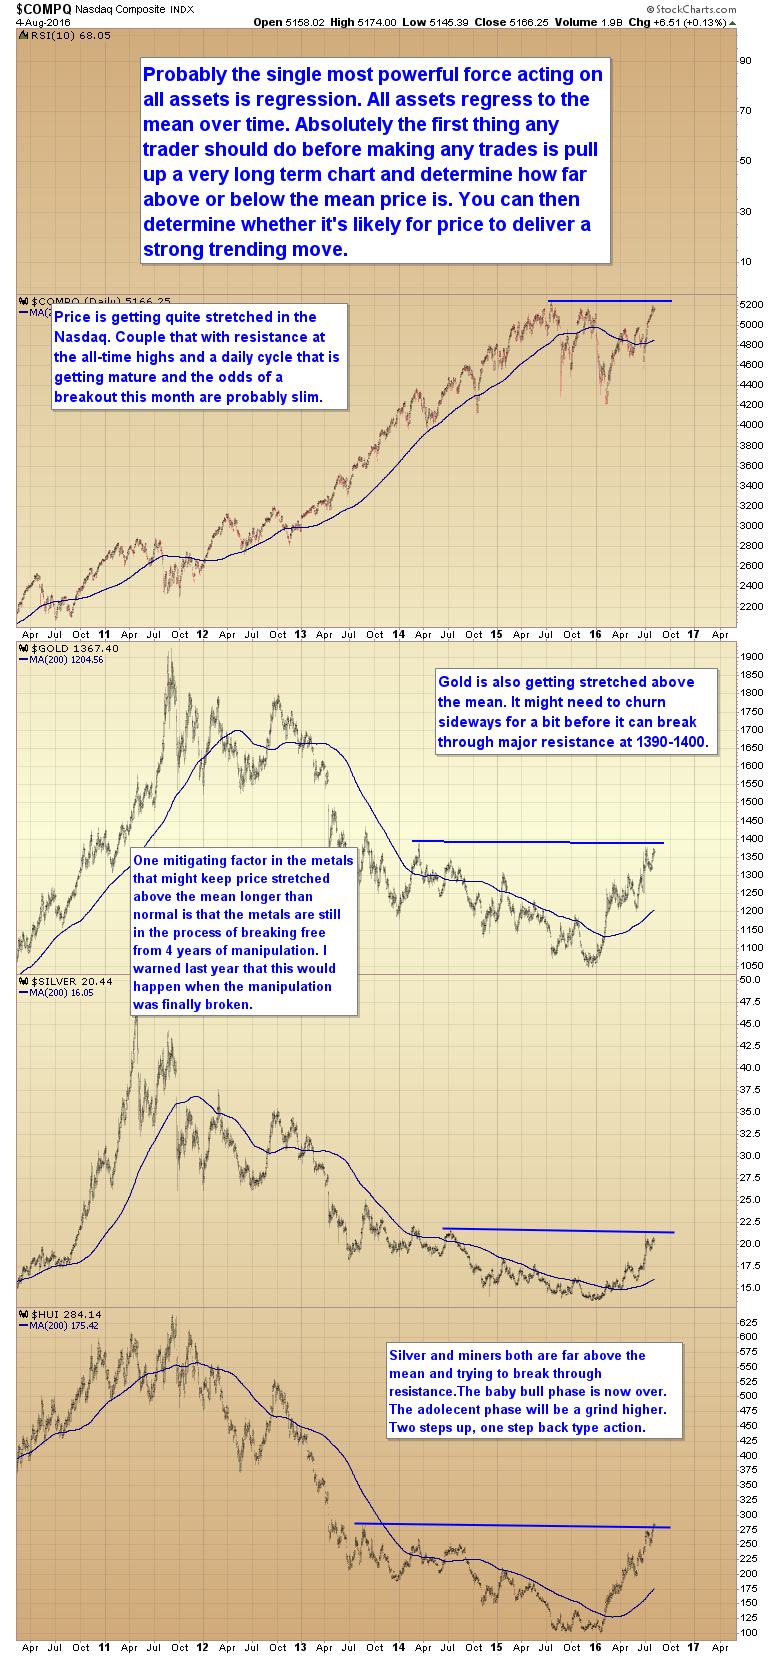
Probably the single most powerful force acting on all assets is regression. All assets regress to the mean over time. Absolutely the first thing any trader should do before making any trades is pull up a very long term chart and determine how far above or below the mean price is. You can then determine whether it’s likely for price to deliver a strong trending move.
Like our new Facebook page to stay current on all things Smart Money Tracker
Gary,
can you do me a favor and put up a US$ chart showing regression to the mean?
The dollar is in the process of trying to breakaway from the 200 DMA into a new bear market. There is no stretch yet. But sometime in late September or October we should see a big stretch to the downside.
Like I said. Gold and miners will have to churn for awhile before they can break through those major resistance levels.
Focus on the big picture. The dollar has a date with an intermediate cycle low by Sept. or early fall. Gold won’t form a final intermediate top until the dollar bottoms.
Likely. Some gold mlners are not responding to decline in gold bullion. Sideways for a while, may be.
time to short $USD .. short, short, short
Wow, what a market levitation!! Look at svxy go. Back to previous high at 95 or less?
So the current intermediate cycle in gold and miners will be much right translated in terms of time to the IC top ?
thanks Gary
Some opinions from the thread would be helpful and welcomed. Short one mini gold contract and one silver contract obviously under water today. We are at a support level in both, but the 200-day moving average is quite far below, any ideas?