Monthly Archives: February 2013

MAJOR TOP IN STOCKS & MAJOR LOW IN GOLD

For months and months now I’ve been warning traders that QE3&4 were going to have a major effect on stocks. I knew that analysts claiming that each new QE was having less and less affect would not apply to this latest round of quantitative easing.

I was confident the latest counterfeiting operation by the Fed would push stocks to at least test the 2007 highs, and I really expect we will see a marginal break above that level sometime this year. Probably by the end of the month. My current guess is that we will get a sell the news type of event as soon as the sequestration can is kicked down the road and that will mark the top of this particular intermediate cycle.

Make no mistake though we are still in a secular bear market. Stocks are testing their all-time highs at the same time earnings are in decline, GDP has turned negative, and unemployment is starting to tick up.

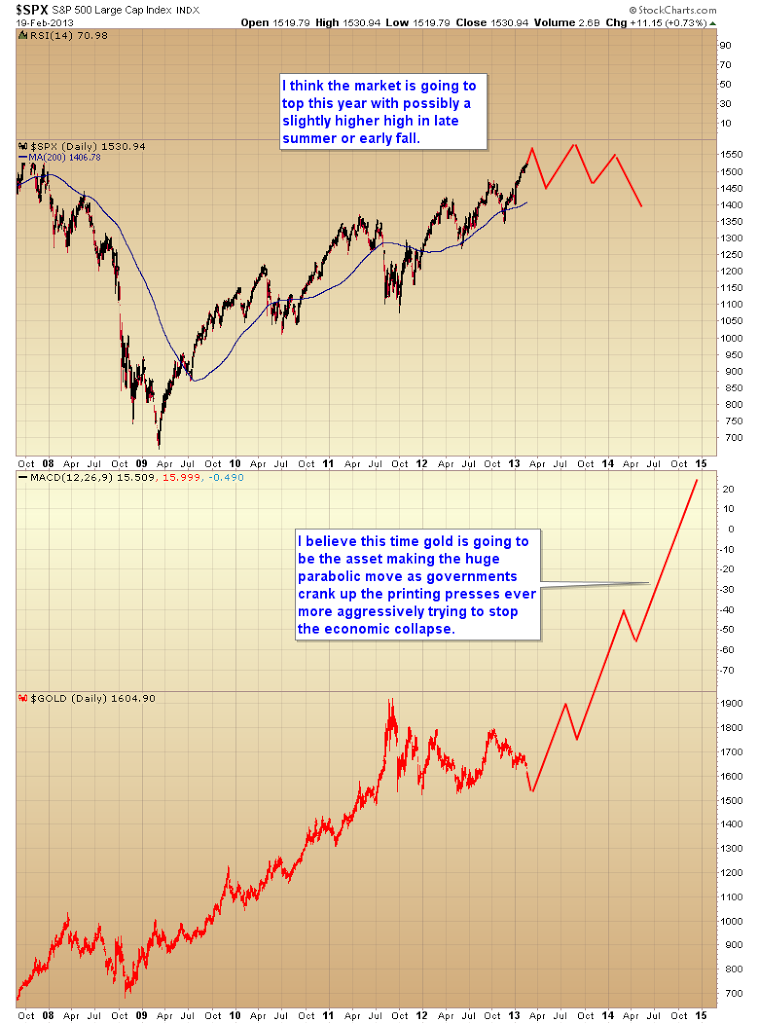
It has been my expectation that the stock market would put in a final top sometime this year. I also expect this will be a very extended and difficult topping process lasting months if not a year or more.


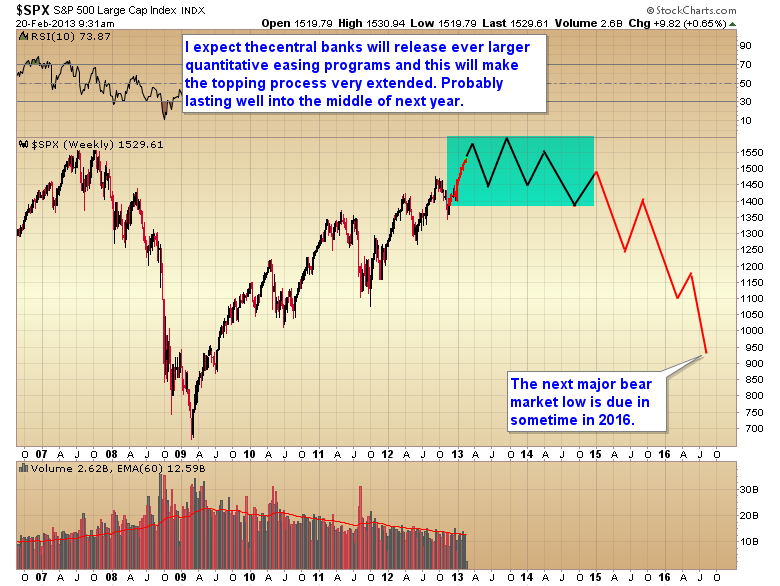
During this topping process I expect to see an inflationary surge very similar to what happened in the oil markets during the 2007 top.


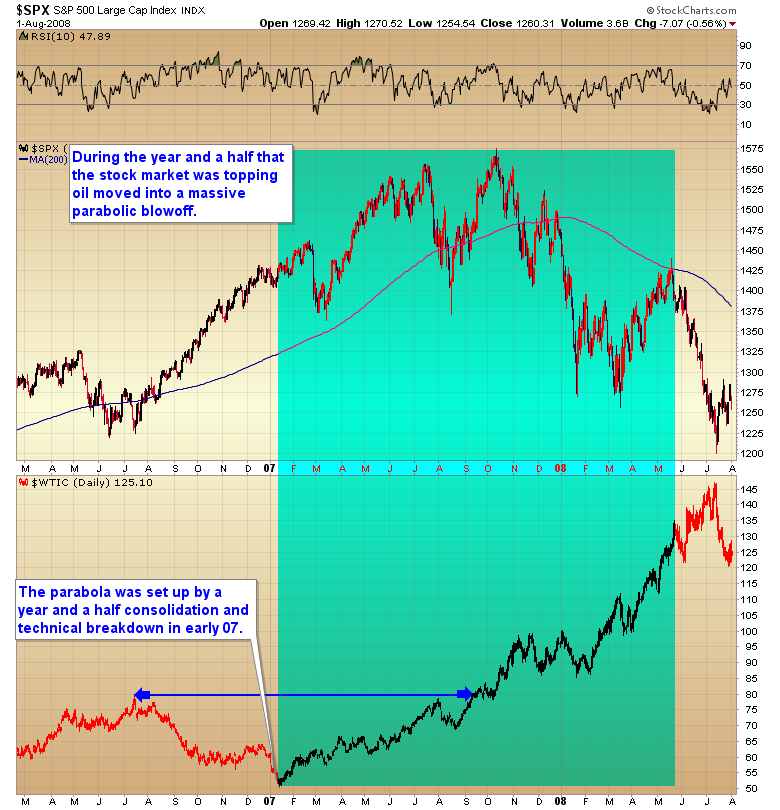
Notice the breakdown in early 2007 that convinced everyone that the bull market in oil was finished. This set up a massive parabolic move into the 2008 blowoff top.

This time however I don’t think it’s going to be oil leading the inflationary charge. In order to generate that kind of move we need something that has formed a long consolidation similar to what happened in oil, and preferably an asset that has declined long enough and far enough to push sentiment to negative extremes capable of convincing everyone that the bull market is over. Those are the conditions necessary in order to generate a massive parabolic move over the next two years.

The only asset that qualifies in my opinion is the precious metals markets. 

The breakdown after the QE4 announcement, and now the extreme move into a yearly cycle low has, I daresay, convinced everyone that the gold bull is over. I would argue that it is impossible for the gold bull to be over as long as central banks around the world continue to debase their currencies. Gold is just creating the conditions necessary for its next leg up, similar to what oil did in early 2007.

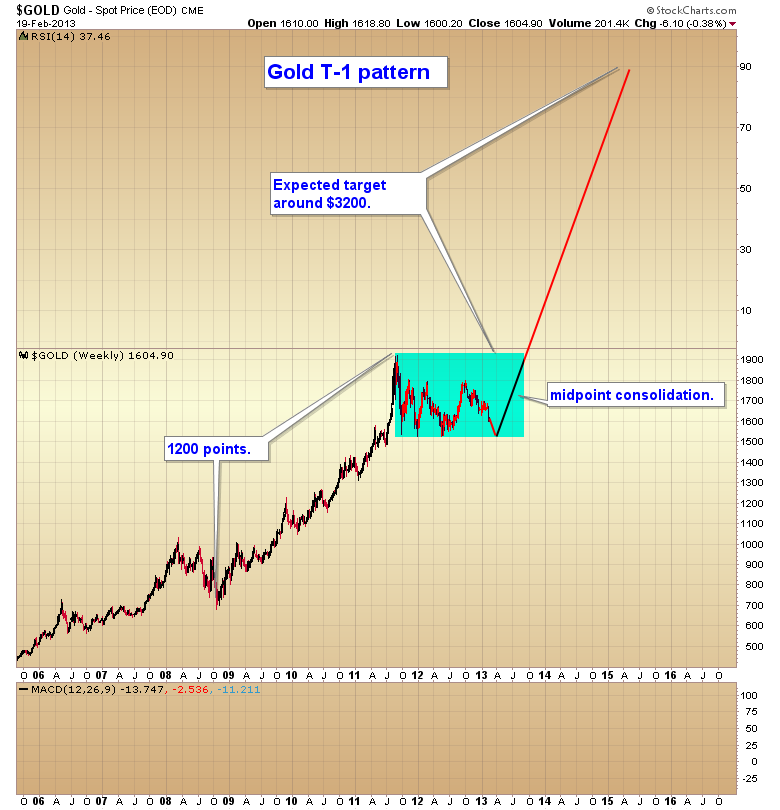
A very similar pattern to what happened in oil is also unfolding in the gold market. I’m talking about the T-1 pattern that formed in oil during 07-08.

Here are the rules of T-1 pattern for those not familiar:

T1. A move followed by a sideways range often precedes another move of almost equal extent in the same direction as the original move. Generally, when the second move from the sideways range has run its course, a counter move approaching the sideways range may be expected. 

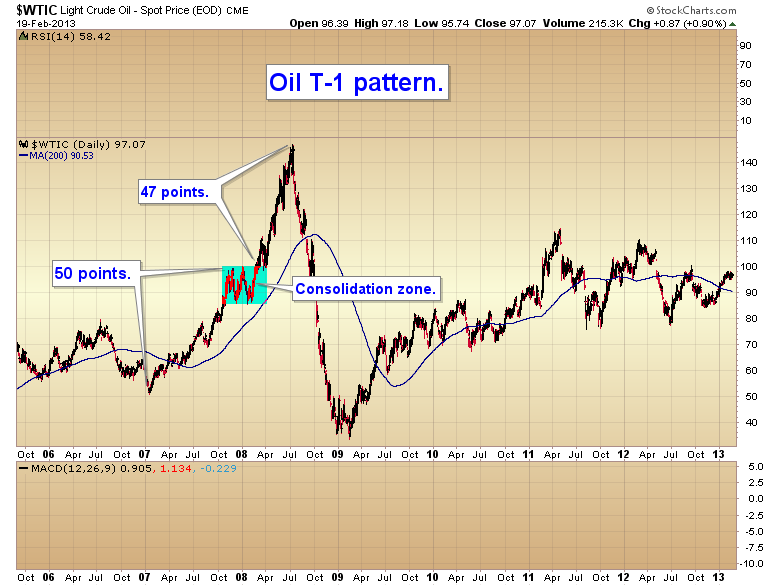
I think the gold chart is setting up to produce a monstrous T-1 pattern with a target around $3200 sometime in the late 2014 or early 2015.


Investors just need to get through the bottoming process of this yearly cycle low. Considering that gold is now on the 15th week of its intermediate cycle, which usually lasts about 18-25 weeks we should be getting close. 

Actually we are probably closer than it appears by that previous statement. The last intermediate cycle ran a bit long at 25 weeks. Long cycles are usually followed by a short cycle. So I would expect this cycle to run a bit short at 16-18 weeks.

All in all, I expect a final bottom sometime in the next 5-10 days. And once that bottom has formed gold should be ready to break out of the consolidation zone it has been in over the last year and a half and get busy delivering the second leg of that T-1 pattern.

THE REST OF THE STORY

I see a lot of people lately agonizing over what we should have done. By that I mean it’s obvious to all by now that the correct move was to buy stocks back in November instead of precious metals and miners. I mean seriously, it’s obvious that liquidity was going to flow into every asset class except precious metals. Well it’s obvious now in hindsight anyway.

Of course everyone has conveniently forgotten how tough it was coming out of that November low. There were ongoing concerns about the approaching fiscal cliff, not to mention a significant sell off as we approached the end of the year. Once the fiscal cliff was resolved the markets rallied violently. Of course no one was positioned ahead of the rally because there was the risk that politicians wouldn’t make a deal. So the upshot was almost everyone missed the first day, and virtually no one was expecting a second day of huge gains.

So by that time the market was overbought and right up against resistance at the September highs. It’s pretty tough to buy into an overbought market that is butting up against a major resistance level, so I don’t think anyone could be faulted for abstaining at that point. Once the market broke through 1475 it only took five days for it to reach the next resistance level at 1500. So if you didn’t buy immediately you missed that move also.

At that point we moved into the timing band for a half cycle low. Again, probably a dangerous time to be initiating long positions. Unfortunately the market didn’t give us a half cycle low and continued higher, with two strong down days thrown in to keep traders off-balance.

It’s easy in hindsight to rationalize the correct trade, but as I have just shown, tough to do in real time.

Next I’m going to show you a market progression. Imagine you are experiencing this in real time.

In August of 1990 the stock market stagnated, formed a double top, and proceeded to plunge sharply below the 200 day moving average. At this point, as we’ve heard many times, chartists were screaming that the market was clearly headed down.

 
Imagine your emotions on that Thursday in August. Realistically, how many people would have been able to pull the trigger and buy at that point? The answer is, not many.

But buying on that Thursday, even though one’s emotions were screaming sell, was the correct move.

 
Or was it?

Well after two weeks the market certainly appears to be building a base for another leg higher. At this point, although almost certainly nervous, one could probably rationalize adding to positions.

 
So let’s see how that worked out.

 
Holy crap! That was a mistake. A huge freaking mistake. Sell, sell, sell!

Whew, that was a close call.


Son of a b***** no sooner did the market break down then we get a strong reversal candle followed by another reversal candle five days later. I have to say, it looks like we finally hit a bottom. Buy everything back.

 
You’ve got to be kidding me! Wrong again. This is obviously a bear market, time to sell short.

 
A couple of days later; Time to add to shorts.

 
A week later; This sure looks like we finally made the right decision, as this is clearly a bear market, and obviously about to begin the next leg down.

 
But did one really make the right decision? Remember this was a secular bull market.
As Paul Harvey used to say, now let’s look at the rest of the story.

 
As you can see, clearly this was the buy of the decade, although actually doing so and holding through that bottoming process was agonizing to say the least, or more likely virtually impossible.

So might I suggest that when the gold bull becomes too frustrating, and you’re ready to give up, you come back and review that 1990 bottom.

Bull markets never make it easy. Very few traders have the determination, stamina, foresight, and focus to make it all the way through one. But the rewards for the very few that can weather every punch the bull dishes out… are huge.

Weekend report

Considering the extreme complacency in the stock market, (I’m starting to hear multiple calls for a new secular bull market) it would probably be fitting that the next crisis is now sneaking up on us completely out of the blue as the Japanese currency begins to collapse. By the way secular bear markets don’t end until PE ratios reach extreme levels of undervaluation. Notice in the lower chart the extreme levels from which this bear market began (PE’s above 40). I think we can safely assume that this bear market is not going to be any different than any other one. 

It certainly didn’t end with a PE ratio of 15 when every other bear market in history ended below 10 and every one of them began from much lower valuation levels (usually with PE ratios about 20-25). This bear market has much bigger excesses to clear than any other bear in history. The rubber band got much further stretched to the upside this time. Normal regression to the mean forces will demand that the bear market should be deeper and more severe than probably any other bear in history.


So I don’t think we need to take anyone calling for a new secular bull market in stocks seriously. I think we all know this is about currency debasement, as there is no new technology to drive a new secular bull market yet.

I warned traders that we were about to enter the euphoria phase of the cyclical bull. This is an ending phase by the way. But the end of a bull can span many months and even a year or more, which is why I keep warning the shorts to be patient.

More in the weekend report