OIL
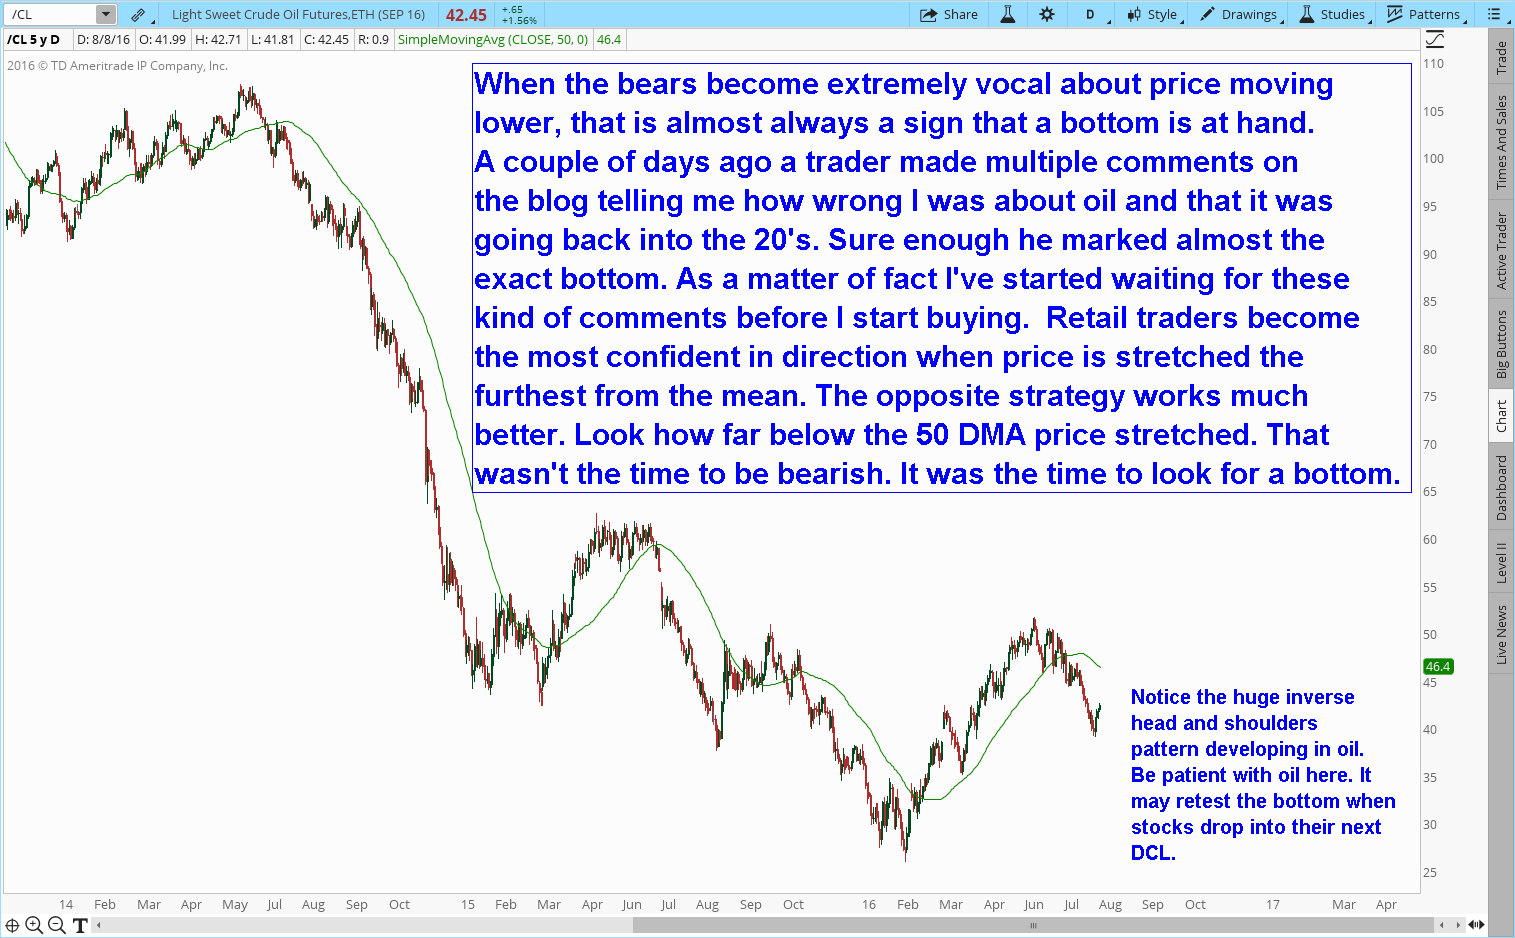
When the bears become extremely vocal about price moving lower, that is almost always a sign that a bottom is at hand. Retail traders become the most confident in direction when price is stretched the furthest from the mean. The opposite strategy works much better. Look how far below the 50 DMA price stretched. That wasn’t the time to be bearish. It was the time to look for a bottom.
Like our new Facebook page to stay current on all things Smart Money Tracker
By retest the bottom, I meant the recent bottom slightly below $40.
Righton; those novice panic ‘I and I only know’ comments work every single time as contrary indicators.
Yes, the huge classic looking inverse H&S has been building for a while now and it could be a doozy.
ERX stuck sideways in 6 point band.
VIX futures are down 2% while the actual VIX index is up 2%. It will be interesting to see how the divergence is resolved over the next few days.
Stocks are moving into the timing band for a correction but ow many times have we seen the PPT intervene to stop, abort or shorten corrections. So it’s always iffy trying to guess when a correction will begin.
Eyes peeled on corrective move
Great call again by Gary ~