S&P 500
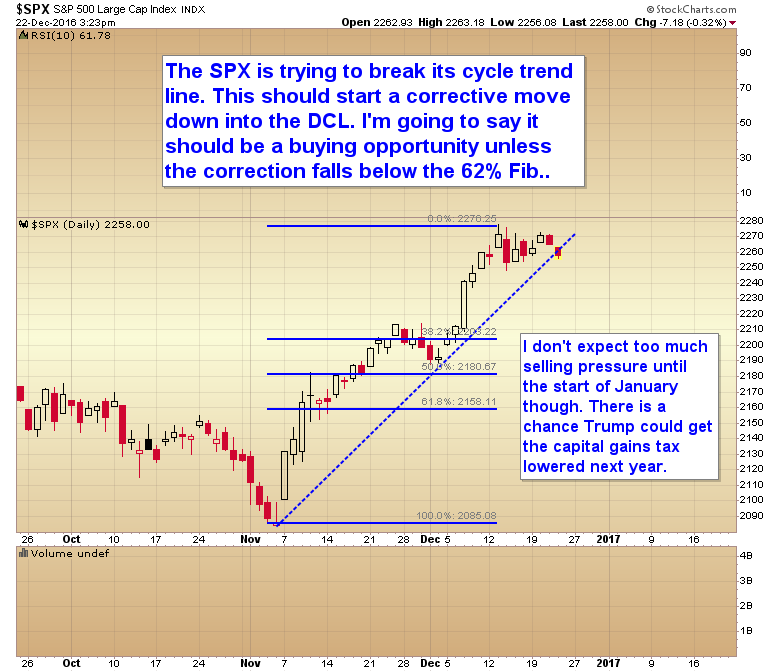
The S&P 500 is trying to break its cycle trend line. This should start a corrective move down into the daily cycle low.
Like our new Facebook page to stay current on all things Smart Money Tracker
S&P 500
The S&P 500 is trying to break its cycle trend line. This should start a corrective move down into the daily cycle low.
Like our new Facebook page to stay current on all things Smart Money Tracker
Sounds plausible.
I also show the SPX’s short term Daily or Trading Cycle has likely topped in my post from earlier today. Note how price topped right at the top of my price channel (2nd chart):
https://surfcity.co/2016/12/22/spx-trading-cycle-2/
Also, the USD is at a critical juncture and is “Wedging” to a decision point after topping (so far) on day 8:
https://surfcity.co/2016/12/22/usd-trading-cycle-update/
Hey Surf! Can you believe the bull trap on JO? Drop down to 5 cents below the lowest pivot! Cleaned all stops out..
I think I’m on to them though (on this one)…
They did not get mine just yet but close. I still believe the Bull case in Coffee but the Bull case needs to emerge in the way of price action.
$COFFEE (not JO) still hasn’t hit the 62% fib yet.. So, we’ll see if it bounces off that..
Gary, you could very well be right. But, stocks will only stay here or go up if more money is injected into the system. And, that means bond yield will be prevented from going up, at least for the time being. If that is what happens then gold WILL do well even in dollar terms.
And, I guess that that is what will happen. That is why I am bullish on gold at this point.
But, this is contrary to what Fed wanted to do at this juncture by increasing fed/overnight rates. They wanted to decrease liquidity albeit a bit.
This will be the first time since 1995 Fed would not get what it wanted. That does not bode well either for the SM or the economy,
raise rate, SM down.. according to DT
For your consideration. Take from it what you wish.
https://www.youtube.com/watch?v=RWpoo2lWje4
Thanks for sharing this!
This is a must interview to listen to. Any bear and bull has his technical outlook but the reality of underlying evidence as proof all over is out there. I have listened to many people studying gold and all come with different evidence that all indicate to only one thing …GOLD will rocket when they can’t contain the manipulation, but rise it will, with last possible dip by the powers at play to achieve total pessimism for maximum gain.
The point is the the world is in chaos (many western false media news on India, China and wrong comparative figure that’s changed (previous) when new figures come out..who checks the old comparative they use?), the financial system is in chaos with diverse rigging and NO chart technical reading is going tell the market where its going for much longer for the piper needs to be paid. The clever money is moving cash and tearing out all stubs from the cheque book for all the stops, with more money has been flowing in this past month than in past year, creating peaks to get out, NOT to get in ….but all for the public to get in and hold the bag. Those doing the in-depth homework are not fooled and there is a few. the sign talked about by many that are accumulating is past two months and escalating!
Gold bugs, we need to be patient.
Dday put this chart http://invst.ly/2zj89
The technicals are not ready yet.
A lot of people rely on them and so technicals equals to a bit of sentiment.
But guess, what? Shares will be cheaper to buy!
Good trading to all.
Sorry here is the correct link http://invst.ly/2zj7z
I like Gary ‘s post.. There will be exhaustion ; good time is first of the year, just like last time..
Ich denke eigentlich, dass ETM genauer ist als EWT. Nach ETM, Gold und
Silber sind in der fünften Welle, die die vorherigen Höhen von $ 1.920 und überschreiten sollte
$ 50 jeweils, irgendwann Ende 2017 oder Anfang 2018. Danach eine Korrekturwelle
Und dann eine endgültige Impulswelle, die den vorhergehenden Peak der fünften Welle übersteigt,
Irgendwann Ende 2019 oder 2020 vor dem Bullenmarkt Tops. Die GSR sollte
Dementsprechend fallen mindestens 16 oder niedriger und sogar vielleicht 9 oder niedriger, weil alle
Die Quadrillionen der Dollars der globalen Schulden, der unfundierten Verbindlichkeiten und Derivate.
SLEP
Du bist ein größerer Träumer als ich!
Bitte teilen Sie, was Sie rauchen 😉
Ich rauche nicht. 😀
I think I have a clear view of when Gold will turn around, I will hide the exact date with a greeting
*** MERRY CHRISTMAS ***
Gary this support your theory and a must read for others!
Is The U.S. Stock Market About To “Super Nova?”
A paragraph ‘Just like water, markets eventually find their own level of balance. At this point the U.S. stock market, is the most unbalanced financial market in the world. A Trim-tabs report out yesterday revealed that the public threw $98 billion into U.S. stock ETFs between November 8th and December 5th. Compare this to the $61.5 billion that went into stock ETFs over the ENTIRE year in 2015. Currently the rate of cash flooding into stock ETFs for December is even higher than November.
Money from the public is literally flooding into the stock market, making this the most dangerous stock market I’ve witnessed in 30+ years as a financial markets professional. If the GAAP accounting standards enforced in 1999 and 2007 were applied now to corporate earnings, this would prove to be the most overvalued stock market in history on an “apples to apples” accounting basis.’
We are going to see rock bottom faster than most think it seems with the bonds dropping for a reason while clever money is getting rid of bonds and share in a spike, CEO selling shares and the private will be holding the bag! Soon , very soon!
http://investmentresearchdynamics.com/is-the-u-s-stock-market-about-to-super-nova/
If they can still manipulate gold to 1050 I will be surprised but they have very little time I believe and might surprise us with the up sooner perhaps not to repeat the same as last year who know. There is only one future with GOLD and thats up!
In other words, a parabolic blow off top that transfers the risk from the insiders to the public has been executed to perfection. 7+ years into this rally without any meaningful corrections, most overvalued market in forever and tons of channel resistance…Sometimes they do ring a bell at the top.
As always there needs to be a stop-loss spike down before the up and hope to get between now and then my nugt and jnug, possibly I might get some looking at the action but hope for one more dip to load the max
I’m pretty sure nothing will happen in the gold/dollar market till next week. Go enjoy Christmas….
Good morning.
This week the trading range for NUGT is $6.28 to $5.5.
This morning may go to $6.3 to fall to $5.75 to close even. We shall see.
I agree that before going up an under cut is expected. Early in the year the hooks, up-down-up
amounted to about a price movement of about 32%. Yes, it was a lot.
It appears we are having for this week a truly picayune candle, marking a reversal or further down.
However, the weekly candle pattern is strikingly similar to early in the year before it took off!!!
Regardless, I like to see NUGT at $3.5 to load shares; though I am afraid NUGT will never see that price again,
Good trading to all.
Volume is low.
People with big bucks are on vacation.
Likely no substantial play till the second week on January.
Nice gold spike!
Weird, gold up, platinum down.
Just noticed on Kitco that the one-year change for spot gold is down to +55.90. Before long, this will turn negative as the failed rally in gold started in January. So much for the “Baby Bull” LOL
I liked the action today. Miners seemed strong with no real reason to be. Anyway, moved into about a 25% position in JNUG today. This is interesting also.
http://www.kitco.com/kitco-gold-index.html
Thanks for sharing, in more evidence. Since 2014 there has been a huge divergence in USD price and other currency mix xau value to KITCO graph. This is a good indicator something is amis. The minupulation of gold looks like stronger dollar but should be actually $1450…mmm
Sorry dec 2013! the trend US went down and other up in gold value!
Now if we can get a big move on volume, we could have a bounce coming.
IMO the single biggest determinant for gold prices is the dollar. A look at the 12 month chart clearly shows dollar down first half of the year and up second half neatly presents a mirror image of Au in 2016:
http://www.marketwatch.com/investing/index/dxy/charts
I know full well that everyone on the board knows this but if like me, many might tend to spend too much time looking at granular details rather than the big picture. That’s OK for day traders but not so for most. So lets look at the dollar macros:
1) Dollar will keep going up due to momentum and trumpmania until it affects S&P 500 companies revenues, much of which is international. Word will soon leak out that earnings will disappoint this quarter and more next. I think this will happen sooner than most think.
2) When S&P stocks tumble as a result, Fed will have no choice but to postpone rate hikes and speak dovishly to keep this from cascading
3) By the time that happens POG will be climbing rapidly. Many will choose not to miss this second chance rally IMO.
There is an investment psychology term that I cannot recall that depicts the human tendency to expect the recent past to continue indefinitely. Trees grow to the sky so to speak. This dollar rally is a trap for the vast majority afflicted.
dboz,
I also added more shares, half a lot more for 2 1/2. I still can sleep OK.
I want to have five lots at the bottom. Compared with early this year it seems we are at the bottom.
Cheers
As per the price of gold on USD, so far this year it is not a 1:1.
Half the 2016 year USD went down 5% and half up 5%. In a 1:1 relationship that means gold would be below $1000 today. I read then that the price of gold is governed by other factors. Say demand. So whatever it is gold this year is actually with gains.
It never entered my mind that anyone would presume that I was talking about a 1:1 inverse relationship between DXY and $GOLD.
Strike,
Sorry, you are clear and said biggest determinant. In fact if we remove the December 2015 dip caused by SPY then the inverse correlation between gold and dxy is clearer.
I would add that perhaps the leading factor is inflation as shown by TIP. TIP and gold hold the longest correlation.
Because the dip on December 2015 was caused by the SM it is likely that we are now over the BOTTOM!!!!
Gosh, I need to get more shares!
Today could have been position close with shorts covering for the holiday? Time will tell. I am prepared for down side should it continue into the 8th week. Unprecedented move.
Added 1/2 lot more for 3 outstanding lots.
Need to get two more. When?
“High risk, high reward: It takes balls of steel to play this game.”
My own timing model suggests that Gold prices remain flat and calm for the next few day and then an abrupt ramp up in prices and volume. Kind of like last year at this time. Smart money is accumulating miners now as evidenced by the positive action in the miners today.
To me, GDX price action looks like a bear flag that’s forming..
I think it looks like 2008-2009.
Thanks, my thought exactly. I am actually hoping for a little weakness on low volume Tuesday to add to my positions. I don’t think there is much downside left. Those still holding through this brutal 2 month takedown are not going to sell regardless how low it goes. I only liquidated neutral holdings I held since October to get capital freed up to load JNUG and to a lesser extent NUGT.
Gold has gone lower for 7 weeks in a row. Based on my research that has never happened before. The turn is happening now.
I wonder if any one can comment how the horizon looks from the options side point of view, puts and calls?
This site was some interesting data about gold supply/demand:
https://smaulgld.com/gold-supply-and-demand/
Things considered it is not a brainer that for those in the 5 to 10 year horizon buying gold now is a bargain.
Re: Dollar/PMs:
http://www.321gold.com/editorials/silveranalyst/silveranalyst122416.html
Strike,
Thanks for the link!
It is interesting.
bginvestor,
A more balanced view is by considering NUGT, XAU. GDAXJ. GDX, DUST and DDXS.
I think they are telling either a bounce for gold, or sideways for some weeks.
TIPS and TNX have reversed already.
As a side point not always gold has been substantially inverse to USD.
Don’t listen to those analysts that are saying gold and silver are going lower. My secret contrarian indicator is Mahendra Sharma, and he’s saying gold is going down to $775 and silver to $10. Gold and silver are going up folks. 📈
This entire message board is a contrarian indicator. I’ve never seen so much group think in one place. Yes. eventually gold will go up, but I’ve seen dozens of guys “averaging down” into NUGT. Even if/when GDX gets that much anticipated bounce, it will take the move of a lifetime to make some of those NUGT positions profitable. That is the big problem with averaging down into these leveraged products, it’s akin to averaging down into options that are bleeding delta/theta…you need a massive move to be made whole again.
Sharma also said that people born under the sign of Virgo will be richly rewarded next year. Virgo happens to be my sign. Therefore, I will probably have a lousy year in 2017. 😎
Before I forget, I should point out that Sharma also says people born under the signs of Libra and Aquarius should do very well next year. So, good luck. 🙂
I agree with message boards in general being contrarian indicators and I also agree with 3x funds’ slippage being a major burden to overcome, but I disagree with this board being uniformly populated either bull or bear. I’m new here and scanned several reply segments and it looks pretty close to a 50-50 split. What makes this board interesting is how certain each side is on the outcome. Makes for some heated discussion.
Yes, we appear to be thinking here and contrasting points of view. At least we get informed so that we have no excuses for failure or success. This blog is quite helpful for those trading alone and on the learning curve. We are going perhaps through a critical moment in investing in miners. The potential is substantial and it merits deep consideration. For example worst case scenario I may lose 6% of my accounts, and in a non so super scenario and can make 50% of my account, or double my account. Not small potatoes. The think is to minimize risk and from the practical point of view find that edge, which surely would be visible, that will give the confidence to play stronger.
I agree that the R:R gets more attractive each day, but I disagree with the numerous comments of how too many people are positioning for a bounce (at a later date). Using NUGT to “average in” to this decline is not a good approach. A more reasonable play would be some sort of options spread in GDX going out many months and then potentially selling shorter term options against it.
Here is a great article you might find interesting proving: The Great Physical Gold Supply & Demand Illusion ( fake information from Gold institutions.)
Interesting as I have read diverse research coming to the same conclusion of unrecorded flow & demand of Gold.
http://www.zerohedge.com/news/2016-10-21/great-physical-gold-supply-demand-illusion
Thanks!!!
USDJPY down to 111 in the next period.
An interesting fortnight to come.
USDJPY down to 111 in the next period.
An interesting fortnight to come.
Maybe so. But it’s still early days in the coming currency wars. More like a Sitzkrieg. But you know how those things turn out…
Surfin Santa
Merry Christmas and Happy Holidays to all. 😉
https://www.youtube.com/watch?v=tuFr76btbnE&feature=youtu.be