I’ve noted in the nightly updates that gold is now deep in the timing band for a daily cycle low. My best guess is gold should tag the 38% Fibonacci retracement before bouncing out of that short term bottom.
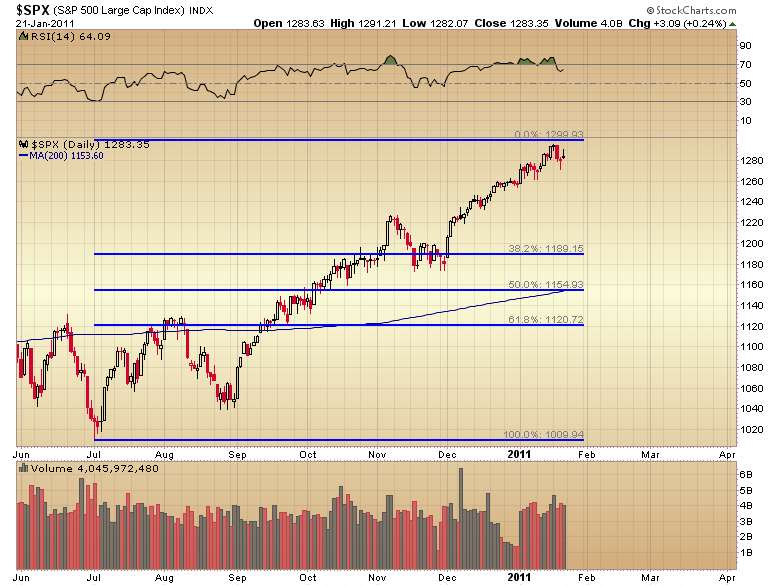
However the stock market still hasn’t moved down into it’s yearly cycle low yet.Both gold and stocks are now due for a major yearly cycle low. This is a much higher degree correction than a daily or intermediate cycle pullback. So the corrective moves in both gold and stocks should be very severe. I would be very surprised if both don’t correct at least to the 50% retracement.
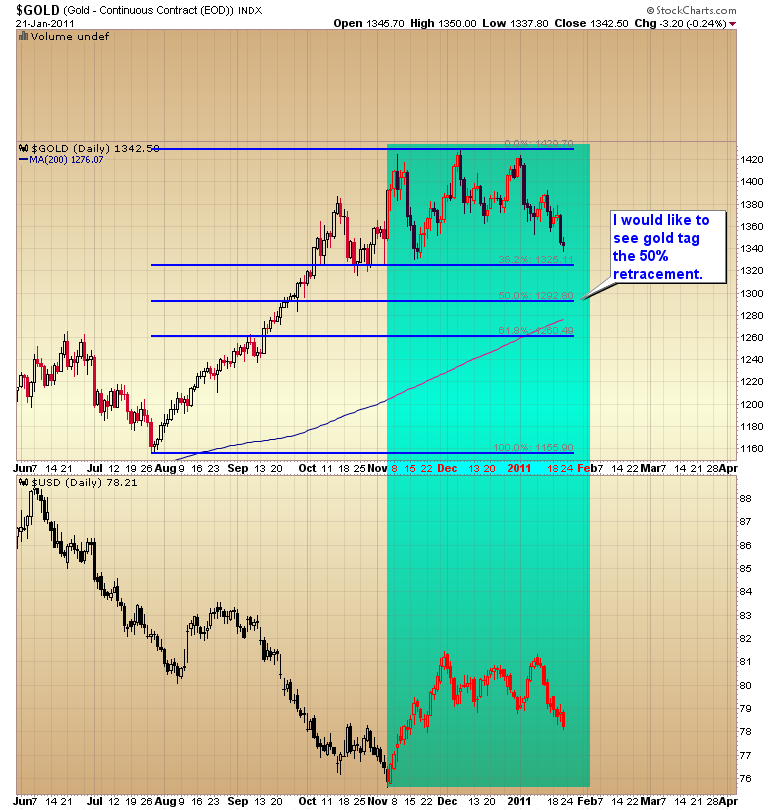
Notice on the gold chart how the rally out of the yearly cycle low in the dollar halted (temporarily) the C-wave rally in gold.
The dollar is now moving into the timing band for another short term bottom. I expect the rally out of that coming bottom to drive the final leg down in gold and to power the move down into the yearly cycle low for stocks.
While I fully expect gold to bounce off the 38% retracement I doubt that will be the end of the correction. A yearly cycle low usually has to do more damage than that, especially if it’s coupled with the massive selling pressure of stocks also moving down into a yearly cycle low.
Those that want to speculate could enter precious metal positions at around $1325, but be prepared to get stopped out if gold dips back below that point next week on it’s way down to $1290.
Personally I’m going to wait until I think the stock market has bottomed before I’m ready to jump back into heavy positions.
Gary,
We are in week 30 of the current intermediate cycle for stocks right?
This seems pretty deep in the timing band for a bottom. If the bottom of this int cycle is also the yearly low, then there is not much time left. If what you say is true and yearly declines are severe, we should expect a real doozie!
It’ll be interesting to see where SLW finally bottoms in this decline.
They have lasted up to 36 weeks before.
Since we should be patiently waiting for pms to bottom(small short-term counter trend trades don’t count), you should post your tournament pics to entertain the troops.
Oil has made a lower low today. As soon as the banks and tech join the party the market should be on it’s way down into the yearly cycle low.
LOL I didn’t take any tournament pics this time. I was busy lifting and forgot to pull out the camera.
I’m sure people can find better things to do than look at pictures of an old guy lifting weights.
An interesting post written by Carl Futia on his website:
I was asked by a friend what I thought about the US dollar and the Feds policy of quantitative easing (QE2). Here is my e-mail reply:
Catherine:
I think Bernanke did exactly the right thing when he pushed the Fed into QE2. Moreover, at least so far, QE2 is a success. How do I know? First, the dollar index is going down (and I think it has a good shot at 65 – but when QE stops the dollar will rally, and rally big time). Second, the yield on the US 10 year is going up while the tips spreads are pretty much unchanged. This shows the bond market is expecting more economic growth, not more inflation. Third, the US stock market is going up, also reflecting expectations of higher growth.
QE works by inflating asset prices (stocks, commodities, real estate and other real assets) which rise initially because investors re-balance their portfolios after they sell assets to the Fed. But rising asset prices encourage their production (real investment) and also make people more optimistic about the future (more bullish “animal spirits” to borrow Keynes’ phrase). These last two effects boost economic growth if there is slack in the economy as there is now.
Carl
Whatever! Old? Hardly. You’re in better shape than most 18 yo. Of course, the whole diet and exercise thing seems pretty extreme to me.
Apparently Carl wasn’t paying attention when the last Keynesian experiment came apart at the seams in 2008.
Maybe like the Fed, he thinks the problem was in the size of the dose not that we were using the wrong medicine.
I expect Carl will get another rude awakening sometime in the next year or so when this Keynesian experiment flops and unleashes an even bigger catastrophe than the last one.
Some people just never learn no matter how many times they get punished. (sigh)
Futia is smart guy and very successful at trading the markets, so I wouldn’t dismiss his analysis of QE II.
However, I keep coming back to the selective “benefit” that QE II provides: It helps those who are financially well off, at least well off enough to have a portfolio of stocks. Turns out only 1 in 3 US households have a stock portfolio worth more than $10,000. So doesn’t that mean that 2/3’s of US households not only do NOT benefit from Ben’s QE, but also get to reap its negative effects, namely increased inflation. Moreover, those who live on fixed income lose out. And those who are retired and have their nest egg invested in interest bearing treasuries, savings accounts, or other conservative investments are also losing out.
Gary,
For whatever reason, you seem to think that anyone who doesn’t share your point of view is an idiot who is obviously wrong. There is no such thing as certainty in the markets.
$ plummeting pm’s sitting still. What will it look like when the $ rallies?
funny that Futia list “the dollar index is going down” as one of the benefits of QE!
That is a benefit if you’re a corporation selling your products to foreign markets, but for the average American, that would be a negative effect, no? Imported goods now cost more and spending time in a foreign country also costs more.
David,
History is crystal clear on this one. Printing money has never fixed the problems we have…never. Sometimes it will offer a brief reprieve in the short term but not once has it ever solved the problem in the medium or long term.
We got a front row seat in the Fall of 08 as to the ultimate outcome of this strategy.
So do I think that repeating the same thing again only larger and expecting a different result is stupid?
Sure I do.
We need to learn from our mistakes not repeat them over and over.
I just don’t see how commodity price inflation creates economic growth except for the big resource companies.
At least for me, the higher my bills get the less money I have to spend and the less I spend because I am preparing for higher costs. Seems businesses, especially small ones, will do the same.
PC,
couldn’t you make the argument that the lower dollar keeps Americans local when traveling so the dollars stay here.
American made products are more competitive in the market place.
The corporations that sell goods overseas employ people locally.
I guess it just depends on how you see the glass (half empty, half full)
Curiouser and curiouser to me. In DeMark land, we are in Week 3 of a 1-4 Week Sell on the Dollar Index. I didn’t think Gold/Silver would be joining the party, but I guess Euro’s problems are solved (again!) As reported last week, Gold futures qualified a down break level at 1350 last week. Kevin Depew on the Minyanville Buzz and Banter (free through TD Ameritrade Research and Ideas) shows this is a significant trend break. From this, we should get a full Daily Buy Setup of 9 bars recording sometime this week, then followed by a complete 13 day Sequential countdown (non-consecutive days, however), so we are looking at least 3-4 more weeks of Gold downside before a buying opportunity will emerge! This corresponds pretty well with what Gary is showing in this post. Will stocks join the downside pity party? Depew has pointed out there is at least 4-5 more weeks for exhaustion to play out in SPX – we shall see. As a reminder, I am still looking at a dollar “collapse” into DXY 72.5 – at that point, the complexion of this game will change…only 7% from here!
If inflation equaled economic growth then Zimbabwe would be the most prosperous country in the world.
Sorry folks just counterfeiting dollars isn’t prosperity…it’s theft.
I’d keep an open mind about that expectation for gold and stocks to find a low together. Only 4 of gold’s last 13 intermediate cycles have bottomed within a week of stocks. The last two lows have trained us to look for such congruences, but a longer history does not support that view.
I would agree, however, that prudence should stop a trader from getting too aggressive without seeing an equity correction. I would certainly stay away from time-sensitive holdings in that case.
Gold can march to it’s own beat. But an intermediate cycle low in stocks almost always bleeds over into the mining stocks, no matter what gold does.
But yes these yearly cycle lows are tough especially when they are closely timed. More curveballs 🙂
Gary,
How long can this market stretch before it finally starts to correct?
Europe may have problems, but their debt is nowhere near the U.S. Surprised Germany is hanging their population out to the wolves. Politicians are politicians though.
Well, as we know, there’s a big difference between the market and the economy. Futia may be a savvy trader, but I’ll rely on better sources for ECONOMIC analysis. Such as John Hussman, who is not a trader (obviously, given short term results) but a very good economist.
It’s important to make this distinction. Futia just spews the same nonsense (IMO) that most of Wall Street does WRT QE, etc. It’s well disputed by real economic analysis that is sustained by long term results.
All that said, I don’t know what Futia’s longer term investing/trading results are, so I’ll reserve comment on that.
I decided to hedge a portion of my brokerage account for a downside move. Any comment on ZSL (double short silver) for that purpose?
Why would you want to short a bull market and especially after it’s already made a large move down.
If you want to short something why not the stock market which is terribly extended and still in a secular bear market?
Could we see 1300 on the S&P here before we rollover?
the dollar just keeps tanking…
Well I thought you were still expecting stocks to take a pounding as we head into the yearly cycle low. Will that not feed over into PMs and PM stocks?
As I noted in the post and in the brief weekend report the dollar is just now entering the timing band for a daily cycle low. Once it bounces out of that short term bottom then we should see the correction begin in earnest.
Greg,
Yes but I still wouldn’t trade against the secular trend. What happens if gold decides to bottom here and explodes higher and the miners decide they don’t want to pay attention to me and rally anyway despite the stock market declining?
You will just end up throwing away money on your hedge.
Hedges are for large funds that can’t get in and out easily without moving the market.
If you are worried about further draw downs then just sell. There’s no need to add another positions to manage plus pad your brokers commissions when all you have to do to stay neutral is hit the sell button.
I still can’t get over Futia’s call most of the year last year for silver to go to 12. (I think the was the number…it was an insanely low target) He lost me there.
Onlooker,
I believe Futia does well in his long term accounts too. His book re contrarian trading outlines his approach, but it’s very long term and pretty much holds to the view that over the very long term stocks will go up.
Futia may not be an economist in your opinion, but he does have BA in economics from Yale, a masters in math from UC Berkeley, and a PhD in mathematical economics also from UC Berkeley.
‘Course, that’s the problem with the whole field of economics: rarely is there any kind of consensus, for every economist who says QE II will save the day, there’s another one out there who says not only will it not work, but it will cause more harm than good in the long run.
pima
Sorry, mea culpa, I talked out of turn on Futia’s credentials. I admittedly based my opinion on what I think is his B.S. view on these economic issues.
I should have stated things differently as there are clearly a lot of “real” economists out there who are full of $#it, and have gotten things terribly wrong over the last decade or two (at least). But that’s a long and dragged out discussion/debate I’m not in the mood to get into here.
Suffice it to say I think his opinion that QE and other mainstream monetary policy and practices, is the panacea that he apparently thinks it is, is crap.
And as Jayhawk pointed out, his trading calls aren’t all that great either, apparently.
Someone on here mentioned MDW some time back. Last Thursday when gold got smoked it started going up, and is up 20% from Thursdays low. Nice volume for 1/2 day… MAYBE a future over achiever???
IVNRT – that was a pretty month
Onlooker,
I believe you will turn out to be right re QE II. PM’s are the reason most of us are here and most of us who are playing this long term bull in PM’s think that QE will ultimately cause more harm than good. I think both you and I agree on this point.
Futia is a smart man, he does miss on some calls, but that’s trading, no one gets them all right. He makes money over both the short and long term, though, and that’s the real measure of success for a trader, right? Not whether they get a lot of calls right, but rather what their bottom line tells them.
Personally, I respect Futia’s work and his success as a trader, but I have not adopted much of his style to my own trading. Maybe in the future, maybe not.
In the meantime, I prefer to play this bull market in PM’s.
Yes I was talking about the very long base on mdw.
yes Brian
I thought it was you or Steven.
also I think it was one of you that said you followed me into SOLF and stayed in it. It (and all solars) look good today- volume wise too.
LDK, SOLF, SOL, CSIQ, JASO
I still own Jaso and SOL
Looked at that MDW again on a 2 yr and 1 yr weekly chart. Actually looks very good.
Last week it had 2 million volume FOR THE WEEK ,and today almost a million already near noon.
anyways, chart looks good.
I’m very bullish on the market this year.
The superinvestors are quite bullish (while some are cautiously bullish) on the market this year as well, including David Tepper, George Soros, John Paulson, Bruce Berkowitz.
Hard to bet against those guys.
This comment has been removed by the author.
This comment has been removed by the author.
From that Citi analyst:
Despite our overall bullish view on precious metals due to the longer-term backdrop of paper
currency debasement, Silver’s triple-momentum divergence reversal after exponential gains
suggests a substantial pull-back.
Both the head and shoulders neckline break and the 38.2% retracement of Silver’s most recent upmove suggest that Silver will likely trade at $25 and possibly even extend towards the 200 day moving average presently at $22.08.
While this would be an aggressive correction it would not necessarily change the bullish trend.
38.2% retracement of recent uptrend = $25.00
50% retracement of recent uptrend = $23.00
200DMA = 22.08
What are people’s thoughts on where silver will bottom? We think gold will bottom somewhere between $1290-$1330 but what about silver? Any educated guesses out there?
SLW just bounced off the 50% retracement mark @ $30.4 (rally started at $17.5 and went to $42.3)
could be a good bounce play for those interested..
Looks like Beanie just called the high for the week. Thanks buddy!
whats a decent strategy for buying at the next gold bottom? gdxj? certain miners in particular?
are there any consistent outperformers or is this a crapshoot?
thanks
Back of the envelope math. If Silver declines 2:1 gold and gold down to $1,275 has Silver in the $24.50 range
Gary,
(or others who will share)
I am considering buying physical gold and silver. What is the best way to hold it; Coins vs bars? and if coins, any preference on which ones?
Thanks for any help.
Poly,
That would be interesting if gold falls that low but I don’t think Gary believes it will get there (nor does Doc). Of course anything is possible. The two variables are:
1. How far gold falls
2. Whether silver exhibits relative strength or not (maybe the ratio will be 1:1 or at least something less than 2:1). Keeping in mind that Gary astutely noticed silver’s relative strength on the last IT in July which is why he thought it would outperform.
Who knows! These intermediate lows can or often bottom on massive final drops, intra-day these targets are very possible, IMO.
Dan coins carry a high premium on purchase, silver is sometimes over spot by $4, gold coins $70-100 over. If someone actually has to buy bread with pm I am not sure how the store owner would react to a gold/silver bar as opposed to a coin…?
Dan,
I like American Eagles for gold and 100 oz. Swiss bars for silver. I have noticed lately gold and siver has a higher premium on some sites. Last time I bought gold they sent me buffalos instead of eagles and I returned them. It is just a preference to me.
In gold I would prefer Buffaloes as they are purer gold
99.99% pure gold over the 91.67% gold used in the American Gold Eagle
Silver –I prefer rounds or bars.
Folks,
I first ran across Carl’s blog 4 years ago (2007). At that time, he was calling for a super move up to complete a 3 peak and dome formation. When the corrections started, every dip was a bottom call. He did this for almost 12-13 months until September of 2008 when the Dow was at 7,700. He didn’t change his stance until a staggering 6,300 DOW points!
He was also one of the biggest bear on Gold & Silver. He ‘tried’ to call a top at 600,700,800,900,1000, 1100, 1200,1300…it was until recently he changed his thoughts on gold going higher. He essentially was wrong for 600-800 points.
Ask yourself this. How in the WORLD could he had done well in which he was SO wrong in one of the nastiest bear market in history in equities and bull market in PM?
March 2008
http://carlfutia.blogspot.com/2008_03_01_archive.html
“I think the next development will be a rally from current levels to 1390 or so.”
June 2008
http://carlfutia.blogspot.com/2008_06_01_archive.html
“Spiders – September S&P E-mini Futures: The market is in a trading range which I think will be followed by a rally to 1500. Today support is at 1300. From that level I think we shall see a rally to 1330.”
september 2008
http://carlfutia.blogspot.com/2008_09_01_archive.html
“Spiders – September S&P E-mini Futures: I think the e-minis are headed for the 1160 level. From there the market should turn up once more and a rally to 1300 should begin. “
November 2008
http://carlfutia.blogspot.com/2008_11_01_archive.html
“Spiders – December S&P E-mini Futures: I think a rally to 1000 is underway. The Next upside target is 925. Support is at 840. “
January 2009
http://carlfutia.blogspot.com/2009_01_01_archive.html
“March S&P E-mini Futures: Downside target for the e-minis is still 820-25. The market has dropped as low as 833 this morning but then rallied to 846.50 after the GDP news. A move above 850 will tell me that the drop from 876 is over and that the market is headed for 900 and then for 1000. “
If you find this amusing, have a look at his Gold call from 2007 to June 2010.
April 2007
“GLD – April Gold: I think that both GLD and April gold have begun an extended decline that will carry gold well below 600. Resistance in the futures is still at 665.”
June 2010
“GLD – August Gold: The odds are that the market will continue upward to 1320. I still expect to see 875 before 1400. Support stands in the 1160-70 range.”
With all those academic credentials in economics and mathematics, he was down right AWFUL.
Gold/Silver showing much weakness, more so in light of dollar and equities. All the miners starting to get deep into over-sold and unloved territories.
Gary,
Would you still be heavy silver whenever you re-enter if silver isn’t exhibiting the same type of relative strength as it did over the summer?
Probably yes.
Eric H,
I used to read Carl´s blog in 2008. He made a lot of money, even though his bias was way off. He published his trades real time, you can check out his blog entries in 2008, they all have time stamps, plus I was reading them at the time they were made.
Hi Gary,
Welcome back!
Once the low is reached within the next month, would you think options to be appropriate at that time?
Thanks!
If anyone has the itch to trade gold futures around the clock b4 Gary’s signal but doesn’t want to take on a lot of leverage, check out the micro gold future ticker MGC. You can trade different months and it tracks the big contract very well, while being only 1/10th the size.The bid/ask spreads are not bad at all. IB has it, and I believe CME is waiving commissions till April.
I agree with Gary that hedging the market is only useful for large funds because they can move the market by selling a large position.
Small investors don’t have that problem so it’s more efficient to pick a direction and stick with it or get out.
FWIW, I don’t agree with the “holding a core position” philosophy. That to me is the same as hedging. The only possible reason to hedge might be tax avoidance.
HUI making new lows for the move down. Licking my chops, but still too early!
SVM has been taking one helluva beating…13.5 to 9.5 already
Hi guys, 1st comment here, nice SOS on IWM today so far.
I would not use options at this time. Wait till the next A-wave.
The only thing that has any predictive value is the SPYDER’s.
Gary, as you said on your posts, we should be starting a new daily cycle on Gold, no ?
Gold hasn’t put in a cycle bottom yet. It has to put in the bottom before the next cycle can begin.
I do think the next cycle will also be a left translated cycle and move down one time before the intermediate cycle bottoms.
In what day are we in the present daily cycle ?
I updated the cycle count chats on the website.
EricH,
Futia’s trades are public record on his blog. He was profitable during those years of “bad” calls.
The thing is, he doesn’t care whether his calls are “right”. He cares only that he makes money. And he was able to do that even when his overall market stance was 100 percent wrong.
Thanks Gary.
Gary,
Another $40-$50 drop over 3-5 days is certainly not out of the question. Under that scenario, couldn’t (shouldn’t?) that represent the daily AND intermediate cycle bottom? Wouldn’t it qualify nicely in terms of duration and severity?
Just curious is Carl a day trader? That’s about the only way one could make money by trading against the trend, especially a trend as violently strong as the bear trend was in 08.
Poly,
If gold were to tag $1293 in the next 4-5 days then it probably would mark and bottom. I doubt we will see that strong of a sell off though.
It’s probably more likely gold tags $1320ish bounces for a week or so then gradually moves down to $1295 in the middle of Feb.
Gary,
Maybe your next great industry will be coming on line soon. A pair of Italian scientists say they have discovered nickel/hydrogen cold fusion with a byproduct of copper.Not only do they claim to have discovered the process, but they have the units ready to ship in 3 months!
Energy isn’t going to be the next “new thing” but we do need to cure the energy problem before the next new thing can begin.
I expect it to come from the biotech sector.
This comment has been removed by the author.
I expect a final cycle that rolls over from say $1350-60 to $1290 would be scary, especially for anyone holding PM positions.
Carl is not really a day trader. His short term trades, which are the ones he published on his blog, were mostly short swing trades. I would say that he cuts his losses pretty fast, so basically when he´s wrong he´s out of the trade on the same day. But when the trade goes his way, he usually holds it for 3-5 days, sometimes even more.
Gary, in the next gold daily cycle, you expect a left translated and shortened one, right ?
That’s my current expectation. If the pattern of lower lows and lower highs is broken though then that expectation will go out the window.
Just read this
The immediate catalyst for the unwind of the SFP is that the Treasury will most certainly breach the debt ceiling by the end of March unless it gets the benefit of the $200 billion buffer, which counts toward the total debt issued by the UST. However, what that also means is that the US stock market is about to become awash with another $25 billion in suddenly free cash every single week, until the entire $200 billion SFP buffer is depleted. In other words, take the liquidity impact of POMO, which is roughly $25-30 billion a week, and double it! We are confident the US Treasury will announce that beginning with the week of February 14, it will no longer roll maturing 56-Day Cash Management Bills, which means that for the ensuing 8 weeks, one on every single Thursday, there will be a total of $200 billion in incremental liquidity flooding the market, and probably sending stocks, commodities, and everything else that is not nailed down into the stratosphere all over again.
Gary, i know and you already told that it´s hard to guess, but i ask anyway. Where do you think silver will be when gold bottoms ?
$1327-1330 on Gold should be interesting. Bunch of stuff converging on that level. The 38.2% retracement (1328 – as Gary has mentioned), an important low from November (1330), the bottom of a channel line (around 1327), and the 138.2% price extension of the previous down swing.
How about if I just tell you when I think the bottom has arrived.
Gary: Fair enough 🙂
Bob,
May I ask where you read that info?
Thanks.
is anyone else buying the 150sma tag on gold when and if it comes?? right now it stands at 1305.8.
Could be any day now
I don’t think I would use the the 150 as an exact measuring tool. Gold could dip $10 under that, bounce, and it would still look like the 150 halted the decline on a long term chart.
Too many people take these levels as exact points when in reality one should probably draw the line with a fat crayon.
LONG gold futures for a bounce here. Stop on the low 30 min ago.
Interesting “cycle analysis” from “The Chart Store” via the Big Picture blog.
http://www.ritholtz.com/blog/wp-content/uploads/2011/01/1-21-11-SP-Cycles-Table.gif
Shows the cycles from bottom to bottom in number of weeks Of the 18 Cycles completed since 1932 (79 years) the average cycle has run 223 weeks, or 4.28 years.
Fit’s your 4 year (208 weeks) S&P cycle well.
FWIW, both gold and silver are in the process of embedding but on the DOWNSIDE. The theory here is that the current trend (down in this case) is locking in and getting stronger.
We are not at all seeing what normally happens on this blog at intermediate lows. This thing may have a good ways to go yet…….
lol tells us what happens on this blog at the lows?
Lots of trolls spouting death to gold. Last year one fellow was threatening to head over to Gary’s place for a toe to toe (obviously wasn’t the intelligent type). Much venom for sure. Not a bunch of folks eager to buy I can tell you that.
Doug Kass is calling for 1050 on the downside. Alot of trolls follow this guy and will not buy the bottom when it comes much sooner.
Who would be crazy enough to challenge Gary toe to toe? he will get snatch lifted into the air before he can do anything to Gary.
Gary: You often say that only the SPY’s have predictive value as a SoS or BoW indicator, but you have also said that you have never studied it on almost anything else…? What have you looked at, and if not much else, why are you sure only the SPY’s are worth following?
Re trolls: we won’t get that with the anonymous posting now rejected.
When HASN’T Beanie been very bullish on the market for the current calendar year?
DG,
I looked at the QQQQ extensively and it had no predictive value. Same for the DIA. I’ve looked at a few of the bell weathers like AAPL, AMZN, XOM and they didn’t seem to have any predictive value for the respective stocks.
I haven’t really looked at GLD, perhaps I should, although wasn’t someone going to do that?
Gary,
I have a question about miners as opposed to gold (and silver) prices correcting.
If, during this correction, a silver miner regresses to the mean and approaches its 200 day moving average, is it time to start buying, or does ‘regression to the mean’ sometimes mean ‘regression to below the mean’ and I should wait for the correction to continue?
One of my favourite silver miners, 55% above the 200 dma in early December, is today less than 10% above, as an example.
Usually it’s better to just wait for gold to bottom.
At some point individual miners will probably start resisting the decline but I doubt they will make much upward headway until the intermediate trend in gold reverses.
Thanks, Gary. I will resist (though must admit have added a little over 35% core, and may sell into the bounce to wait it out).
By the way, regular posters, I have been avidly reading this great blog, and appreciate the discussion.
If you’re antsy to buy then it’s probably too early. When you can’t buy that’s the bottom.
I think last Feb’s low got nasty here on the blog because Gary stayed invested much longer and many got caught in the brutal correction. This year, he pulled the plug early and got everyone out safely.
Off topic:
But for those who did not see the Golden Globe’s opening monologue by British comedian Ricky Gervais, it’s a MUST SEE!!
http://www.youtube.com/watch?v=BvHXzP2SpLA
Another must-read from John Hussman:
Sixteen Cents: Pushing the Unstable Limits of Monetary Policy
He does a great job of showing how the Fed is painting themselves (and us all) into a corner. And thus why their whole policy approach is doomed to fail, and why inflation is gonna come.
I love Hussman’s weekly commentary. It would be tough to invest with him though, because he invests based on how things should be and that hasn’t worked lately.
Just scanned the large caps. Somebody forgot to tell IVN there was an intermediate correction going on.
Gary: I believe Pima did look at GLD and he said it called a number of intermediate tops. This may make sense because SPY is the best hedge for the SPX while other stuff is unnecessary. GLD would be a good hedge for PM’s, no?
Someone on this blog posted the chart below: Your thoughts please?
http://img524.imageshack.us/img524/7639/goldsos.png
Gary,
You said, “If you’re antsy to buy then it’s probably too early. When you can’t buy that’s the bottom.”
Do you ever get antsy to buy? Or have you managed to train that out of yourself? How do you manage your emotions?
Could be tomorrow we hit our fib target of 38.2 %.
I will buy a few shares and play the bounce.
I see GDXJ hit the gap at 32.0 and SIL at 21.0
Silver major support only 30 cents away @ 26.475 bounce or plummet…
I have to admit based on the gold chart, that gold is about to fall off a cliff. Meaning it would not surprise me to see gold hit 1300 in one fell swoop tomorrow
DG,
I guess it would be tough to tell unless one knew what the rest of period looked like. A bunch of little nothing 5 million SoS doesn’t really make me want to sit up and take notice and if they are occurring all along the time line then they are probably meaningless.
When I see a huge -370 though that does catch my eye. But it seems to be very rare. So all in all I’m not sure we are going to get much of an edge in real time by trying to add up a bunch of little 5-20 million days.
Ok make that 20 cents lol.
Bede,
Well for one I don’t just pick an oversold condition and buy hoping that will turn out to be the bottom. One needs to at least have a swing low before any bottom can form.
I’ve said before I usually like to see some kind of major technical level broken before I try to pick an intermediate bottom. Then as long as we are in the timing band for the daily cycle low I just take my position and hold on even if I don’t time it perfectly.
AKA I would never stop out of an entry on day 25 of a daily cycle. It’s too deep in the timing band for a low. If I have to weather a draw down for a few days so be it. I just figure I’m “close enough” at that point.
Both the xau and the hui are within a hairsbreadth of their 200dma.
Is there any significance to this? If we are investing in the miners, should we be keying off their moving averages instead of the metals themselves?
Could it be that the miners have already priced in much of any coming decline in the metals?
(cont’d)
OR, if the $hui and $xau punch decisively through the 200dma, does this signal that something more ominous is afoot — the “D” wave?
I prefer to wait for gold to bottom. Miners can easily move below the 200 DMA like we saw last year.
What I would look for is the miners starting to resist going lower even if gold declines. That would be a sign that a bottom is approaching.
Hi Gary,
Given the expected severity of the upcoming intermediate correction in the PM market that may take the HUI down to the yearly low, how is it expected to affect the upcoming C wave (in terms of timing and return). And if this does indeed mark the top of the equity market and the bear market resumes, it is likely that it’ll simply negate the C wave in PM related stocks? Your comment much appreciated!
Only if the 3 year cycle low in the dollar is negated. And it certainly doesn’t look like that is going to happen at this point.
Gary,
Yes, I just checked the 2-year chart of both indexes and it seems they overshot the 200dma by about %5-10 at the bottom last year, and I would expect the same this year.
So it looks like we can expect a trip to about XAU 180ish this time. About %10 lower from here.
Gary: You may be correct on that, but honestly, with all the time you’ve spent studying gold, its cycles, and how it trades, and the great work that has resulted from it, I am surprised that you have never really sat down and done the analysis and studied the SoS for GLD numbers. Maybe they are more cumulative than SPY. Who knows without looking? Please understand that’s not a complaint as you do great work, but you already like SoS type analysis, and have studied it for all those other items (Q’s, DIA, etc.) so…?
I guess I would have to ask what’s the point? I can usually get pretty close to tops and bottoms with cycles, sentiment and regression to the mean strategies.
I don’t think the SoS data is going to improve my timing any, certainly not when it’s as vague as 5 to 10 days of smallish SoS days over several weeks.
So am I going to quit watching Stana Katic on “Castle” to do research tonight?
Probably not 🙂
Has anyone posted a link to this Graham Summers article yet?
http://bit.ly/e3efvv
Money quote: Gold has formed very ugly technical patterns both in the long-term and the short-term. In the short-term we have what looks like a dome top forming. . . This is one of the cleanest dome top patterns I’ve ever seen. The downside target for it is around $1,250… which coincidentally lines up the Gold’s long-term chart pattern target as well.
Let me be blunt here. If Gold falls to $1,250 per ounce and Silver falls $25 per ounce it’s time to BUY WITH BOTH HANDS.
if gold falls to 1250 silver will definitely be in the 22s..
1300 gold and 25 silver looks more feasible…
Someone posted a link to Peak Theories recently. Thank for that, whoever it was.
Abagail has some really wonderful commentary and she thinks it is either a diamond top or a dome top also.
Gary, congrats on your tournament. Keep exercising everyday. Jack LaLane lived to a very healthy 96. Just think of how many bubbles you could get us through in that amount of time.
😉
Cute Gary. But sometimes things aren’t clear. For example (and just hypothetically), when gold made its higher high and we got that “buy back in” curve ball only to get stopped out shortly thereafter, had GLD’s SOS been huge it might have slowed you down. For me I was slowed down by the $BPGDM being over 90, and its having an excellent track record as an indicator. You of course do great with sentiment, cycles, and regression to mean, but you use the same things for stocks AND add SPY SoS as a factor. That could be done for gold as well—sentiment, cycles, regression to mean…and SoS on GLD, just like stocks. O.K., I’m done with this topic. Thanks for putting up with me.
Wow, London laying the smackdown with gold under 1325. Should be a very interesting day!
So we hit our 38% fib target of 1325. We just might open lower today with a gap down. This may be the potential swing low we have been waiting for.
A REQUEST TO ALL SUBSCRIBERS
Are there any UK based subscribers/followers here?
I would welcome some conversation with UK based traders, especially about putting a basket of junior miners together as I don;t have easy access to GDXJ.
If anyone is interested in setting up a discussion group or something, let me know.
Ta.
Strellsy (TA)
I am in the U. S. , but I just wanted to mention that in putting together a small basket of juniors due to your situation-you may get some good advice on quality juniors from some members who have looked into individual companies.
Also , you may want to mention your ‘risk’ desire. Some of them are producers, already pulling gold/silver/etc out of the ground. Riskier ones are just explorers. They drill for results and if they fail to find minerals, sometimes experience unusual selling .
Some juniors to research are under U.S. Tickers…maybe they are available to you??
SLW , PAAS , HL , AXU , NG
EXK is a good producer with record results (Endevour silver)
and what about SIL (Global X Silver Miners)?
No recommendation here, except to do due diligence 🙂 hope that helps as a start.
Kitco has a low of 1321.7
From sentimentrader this morning:
Rydex mutual fund traders have heeded some pundits’ suggestions to pare holdings of Gold, with their assets in that fund dropping by more than 40% over the past few weeks. If history is any guide there, the metal shouldn’t be subject to much more of a decline before a rally attempt.
I’m seeing $1325.60. An almost perfect tag of the 38% retracement. Gold should rally here at least for a few days.
If it takes the form of a bear flag then we can probably expect one more leg down in a couple of weeks.
Gary-
For those of us who weren’t around in 2008 & didn’t watch your calls then, I’d love to hear how you played the gold cycle that year. When did you get out, did you go to a core, when did you buy the panic sell off, etc…
Also, did you have the subs short? What did you all buy.
Just curious.
DG,
FWIW here are the reasons I added back. And even if GLD had seen heavy selling I don’t think in real time it would have offset the positives.
First and foremost the dollar broke down and made a lower low.
Gold made a higher high.
Gold appeared to be consolidating in a triangle continuation pattern.
Silver broke out of a triangle consolidation/continuation pattern.
Many juniors were breaking out on very heavy volume.
The stop wasn’t very far away if I was wrong.
Given those conditions in real time I would have to make that same decision every time even if a large SoS day popped up.
Jay,
I sold all gold positions at $975 in preparation for a D-wave. I could have waited a bit longer but I was getting ready to go on a three week climbing trip and knew I wouldn’t have access to the internet for days at a time.
Was too early getting back in. Expected the B-wave to bottom at or around the 1980 high of 850. Didn’t expect the massive selling climax in the fall of 08 which in hindsight we now know was the 8 year cycle low for gold.
I’m really not questioning the buyback. It made perfect sense to me. If every trade worked you’d own the whole planet by now and be insufferable! My observation was just that you use SoS for stocks, so maybe it would be useful for gold as well IF it works, and if so the time spent researching might be well spent. Maybe you feel you have enough indicators for gold already and it’d be superfluous, but there are even more indicators for stocks and SoS makes the cut for that asset class.
Looks like SLW filled that gap.
Well we have a start with the chart you posted. I’ll keep tabs on it from now on and see if it only shows up at or around tops and bottoms.
Jay
are you going to try to play the SLW gap fill?
not
Most of the silver miners heading towards 62% retracement of the move from July (PAAS, SSRI, HL, SVM)
NG actually hanging pretty strong.
SLW right at 50% gap fill area.
Most of these charts look like dog crap. Ugly. Don’t pull up a monthly chart on any of these–Nasty bearish engulfing candles across the board.
Notgreedisgood-
Your name gives me guidance on that play–I think I will pass! Massive downside momentum right now on all these.
@Jay
well if you want to know, I decided to go against my principle and play it, considering that before this downdraft, i exited even my core position
not
I don’t think that’s a bad call at all.
It looks like the HUI is at a key level for a bounce too.
NOT…
You are NOT alone 🙂
GDX is exactly where I thought I would dip my toes in , play it as a bounce BUT decide later if I want to sell on a light volume bounce or hold on.
Some of these have heavy volume (panic-like sell off). I am looking for a bounce , and maybe come back down and retest these areas ( shaking out any who buy this bounce)
i am actually scared to buy now after this bloodbath…the bottom must be coming
AG-First Majestic-
WELCOME TO THE BIG LEAGUE! Nice sale going on there. Down 60% since Dec 15th.
I’m not playing any of them, but you’ve got to think that these are due for a good bounce. $GDM dipped well below 200dma today and $HUI up on 200. $BPGDM now at 40%.
Caveat being the famous “it can always get worse”
Anyone who thinks the gold bull will end in a bubble should read this article over at USAGOLD by Michael J. Kosares. “How Gold Became Politically Correct”. It’s likely physical gold will plateau at an extremely high price relative to paper currencies and not fall back.
http://www.usagold.com/amk/newsletter0211.html
Of all the indicators, the thing that seems most predictive of the stock market lately has been the seasonal tendencies.
On that note, we’re in the January end of the month bulge.
Each of the next six days has a bullish bias, and the six days combined are 19-3 when the S&P is up at least 2.5% since Thanksgiving.
Boy, stuff is really lining up: $BPGDM below 40 is usually required for a bottom after a 90 reading and we just got it, Rydex PM traders have bailed out; COT has finally turned positive; SIL just showed up on one of my buy screens; we are near $1300. Gary, if you nail this next bottom I will mail you a whole live chicken (nothing but the freshest ingredients for your next burrito!)
Perhaps the market is so small in gold that you will never see the eye catching BOW SOS numbers you would on the SPY. Being trained to look for eye catchers, these on gld may seem unimportant, but really could mean something. Last week every bounce seemed to be met with small SOS.
My work is telling me the bounce out of these lows might be weaker than we’d hope. Although I like the prices of many miners around here, the short term upside is not worth playing, IMO. Sticking with core for now and will plan to buy after the next pullback from an expected weak rally.
just an observation..
on a 5 day chart , HL and AXU and others seem to have exploded down w/volume last Thursdays sell off in gold.
Easiest to see on a 5 day/30 minute chart HIGH VOLUME sell-off. Then a sideways bounce/consolidation.
Today , a rapid sell-off on LESS volume,and it feels like a quick sell, then accumulate, because price down doesnt match the high volume . It looks like buyers are buying the sellers stocks.
Bought some AXU , EXK , HL…for a trial run
I just bought my first PM item since $1400 (I have been out as i am not “core holding” believer). I bought a very little SIL. If we bounce I will likely flip it; if we don;t it’s a tiny start on a large position.
If one wants to play the bounce along with the small possibility that gold will bottom at the 38% retracement then now is the time to jump in.
Buy and put a stop under today’s intraday low.
bought some SIL under 21.0
IVV & SPY at the top of “Buying on Weakness” on WSJ. Does that mean we don’t see a trend down day?
Real time 60 minute Gold chart:
http://tinyurl.com/60mgold
It almost feels scary enough
DG..if you dont have a core position, then you have a lot of play money down here…that alone must feel good 🙂
My core was light because I was trading with a % to build it up, but its starting to ‘feel’ to me that even a bounce, then a SLAM DOWN back to below this area could be a successful retest, and then the low.
Looking at the GDX and HUI retesting their breakout area , quite oversold , and sentiment down.
BUT ESPECIALLY C.O.T. levels (short gold)at a 2 yr low!! I NEVER bet against them.
Personally, I’ve never found Bow or SoS to be of much use in trading, other than possibility a confirming indicator. I don’t even look at it anymore.
OK, once a junkie, always a junkie. Picked up some SIL @ $21.00, stop at $20.79.
Looking for a $2 pop sound about right to you boys?
One thing that leads me to think the metals could have one or more downdrafts still ahead is that the $CRB remains elevated on the weekly charts. If the other commods start to come in short term (for a month or so), it could stifle the upside in metals.
POLY
I like it, looks right to me on a 5 day chart too,just watch the bounce if thats a ‘trade’ to, because on a 5 day chart, the last bounce out of Thursdays slam was quite weak/sideways
but take it for what it’s worth…
…you re getting advice on your addiction from another junkie 🙂
Gary,
What if we don’t bounce here and just keep going down. How would that change your overall thinking/strategy?
Yahoo finance headlines: Gold Prices Hit 3 Month Lows.
I’m guessing we’re in for a rally in gold starting today. We’re in the timing band and the media is making noise about how gold keeps going down.
Alex: Yeah, I am virtually all cash and trying not to drool on myself quite yet. I am down 1.5% in gold and 1.5% in my other trading for the year, which hopefully will take about two minutes to recover once the PM bottom is in (hopefully—and assuming we get it near right)
POLY
If you’re reading this
SIL on a 1 day chart 15 minute time frame is going down to retest that EXTREME volume low (132,000)for the day…and its retesting on 38,000.
This is very positive, I hope you dont get stopped out.
DG
You are in a good position to follow Gary and play it safe and still make some killer money I.M.H.O.
If this bottoms here, bounces and crashes back down for a retest, you can load up the boat…very nice.
Even if it bottomed and took off now, bottom in…you re entry will be sweet with the size of the coming run.
Yeah we’re all junkies and it’s been to a long overdue PM’s fix 🙂
Might get stopped here, fine with that considering the recent carnage, but got to say that gap down from last Thursday at $23.38 looks attainable.
SLW plunged thru the gap… i wonder if someone is trying to run the stops… either way i guess i was a tad early, or totally wrong about SLW 🙁
not
wow, SLW busted right thru 30, now about to go below 29… who’d a thunkit?
Well, I couldn’t help myself. I took a 10% position this morning between SIL and GDXJ. Seems like a fairly low-risk bounce play – gonna put a stop under today’s lows and see what happens.
I was 100% cash until just now.
What website do you guys use to track real time gold prices?
Looks like the possibility of a daily swing high on SPX today…
Gary/anyone,
One thing I’ve been curious about lately is the iShares S&P 500 (IVV). Why would this show up on the BoW/SoS lists and not SPY?
Interesting article here about the bond market and impact of liquitidy flows on gold.
http://www.321gold.com/editorials/thomson_s/thomson_s_012511.html
Would be interested in hearing your views on this, Gary.
Done,
I have a TOS account for my trading. All charts are real time there, so I can look at gold and silver futures as well as stocks and etf’s
Done,
I use Kitco for tracking the spot price of PMs. I see it mentioned the most on here.
Jaywawks
I got 3 letters for you
R-B-Y lol
To track gold/silver and the US dollar I use http://goldprice.org/live-gold-price.html
You can click the pin in the right hand corner to create a full screen window and also chart MA on it. Very versatile, and no adds if you use the pin.
Strellsy: There are tons of articles like this. It’s why trying to figure out how the 10,000 forces at play in the world economy will interact is not easy to do. Cycles and sentiment govern what happens. If people get bearish enough on an item it must go up. He may even be right, but maybe the bind collapse comes after gold hits $1600. Who knows? If we make a swing low in the timing band for a bottom, and sentiment has turned cold, you buy, and put a stop below the low if you want. Reading this stuff can drive you crazy…or scare you into not buying when you should. My two cents.
Kevin Depew highlighted on today’s Buzz and Banter the techical damage in DeMark terms that has been suffered in some of the bigger gold mining stocks, specifically ABX and GG. Both stocks are on bar 7 of 9 down on a DAILY buy setup, so should see a reaction Friday to Wednesday to the upside. However, they have both qualified down breaks, which means that there is more selling to come after the 1-4 bar reaction. As the down break implies a full Demark sequential countdown for a buy, there is at least 3 weeks more to even consider looking for a bottom other than a short-term trade. Smita Sadana on the Buzz also looked at GLD today – seems like it has a date with the 200 day moving average…
Gary: Congrats on the weekend win!
I believe there is an FOMC announcement tomorrow…Maybe we spike higher immediately after it, and then the fireworks start on the downside.
It sure is a test of patience waiting for the PMs to bottom.
Continuing from previous post, maybe a tag of 12000 on DOW before plunge?
thanks guys
Today, SLW has ~3 times the daily volume
Its going to be a grind working through all this overhead resistance. I expect that the second phase of this C wave will be a lot more volatile than the first.
Gary,
Any chance the State of The Union address will move this market?
It usually doesn’t. So far this just looks like a normal topping process. Once a critical support level is broken it should accelerate rapidly. I expect that level will be 1260.
That Steward Thompson article scared the crap out of me. I think he’s got a point there…could very well happen that way.
He’s not the most crystal clear communicator–but what I think he’s saying is the bond market meltdown could trigger massive money flows in out of the “inflation” trade–at least for the short term. I was looking at the previous C waves and noticed Gary said they were 12 & 18 months. This one started at 864 in April of 2009 and is 20 months old. If Dec was the top of the C wave, a 62% retrace would take the POG to 1084, right to Stewart’s IHS neckline back test.
I guess he’s saying the banksters want gold bugs to puke up their shares so they can put them cheap.
Jay,
You probably should pay less attention to articles and more to the three year cycle low in the dollar. As long as that is ahead of us then the odds are very high that gold still has one more leg up.
Gold is just doing what it always does about every 25 weeks or so.
If gold even gets close to the 1265 breakout level every hedge fund in the world and central bank is going to be buying hand over fist. I know I will.
Bottoms aren’t about technicals. Bottoms are about big value investors coming into the market.
DG / Strellsy (Stewart Thompson)
I am with Dg on this one. I actually read that report and saw his chart called “Death og gold chart” and I noticed that the LAST 8 months on that chart went straight down…from say AUGUST TO NOW. GOLD has done what from AUG to NOW?
As DG said, Maybe it COULD…POSSIBLY end as he said, but when?? Maybe its the D-Wave that we expect anyways.
I think that what he has MAYBE overlooked in his report ( Oddly he is very bullsih gold, just writes that its got a death blow coming)…He thinks China is going to stop buying? He thinks Russia ( that just announced Increased buying), will stop? India, etc…
Thanks for sharing the article, I found it interesting too. I just wanted to put a Gold positive spin on it.
His Chart is from 1996 to 2011 (15years)and in the plunge of the last 6 months, he warns of death to gold, yet it has surged during that very time.Support is below and its a ways off… HHMMM??
Alex-
RBY-you still in? Glad I dumped it right away. I’m tired of trying to be cute. Will just wait until things are cleared up.
I noticed 2009 HUI & GDX peak in December suffered a 30% drop from it’s high points to the Feb lows.
If we repeat-HUI 418 & GDX 44-45.
Gary-hope you are right.
Gary,
if the D wave is happening right now would 1150-1160 on gold be in the ball park of “scary targets”?
Thanks
Jayhawks
Dumped RBY ( later than you, got out with a loss as it crossed the 20sma).
I did some buying today for a number of reasons…( EXK, AXU, HL)– I am thinking (COULD BE WRONG DG!) thinking that we may bottom , bounce ,and retest this area ( or not). So I am in looking for a bounce , and will sell if volume dries up.
If the mkts tanked from here, I am willing to hold as ‘core added’, since my core was light at this point.
All the D-Wave talk is a good sign 🙂
actually I am not scared here nor will I be at 1285-1300. I feel like I am casually waiting for these numbers to appear to start up my march towards a big payday and that to me seems too easy. I’m all cash and waiting, patiently.
Yes the D-wave talk is encouraging.
If this was a D-wave then we would have seen a parabolic spike.
The miners would have stretched a minimum of 40% above the 200 DMA.
And the intermediate cycle would have topped in 10 weeks or less.
Now you see why it’s so easy to talk about buying when gold reaches such and such a level but in real time the decline messes with one’s mind and one concocts all kinds of reasons for why something different is happening and then one talks themselves right out of buying.
thanks
Gary,
I trade mostly the stock index futures, it´s what I am most familiar with. From my experience I´ll say that important tops in the stock market almost always begin with big trading ranges right at the top, therefore it´s very rare for important tops to be blow off tops.
Would you say that in gold the important tops (tops that come before a big correction) are mostly blow off tops, instead of big rounded tops? Do you know what the top looked like at the end of the last bull market in gold(80´s)?
David,
Yes a gold top is completely different than a stock market top. Probably due to the thin nature of the metals market.
LOL
I remember all the D wave talk last year too.
What has the longer C wave been so far in the bull market?
Also, when all is said and done, our ABCD wave analysis is really only a short historical point of view (since 2000) Past performance is not a predictor of future performance, etc.
I’m still prepared to buy our cycle low regardless.
DG,
Thanks for your two cents on the Stewart Thompson article. Scary, to say the least. Whether or not it comes to pass, the article drives home the point that the big boys are always the ones who move the markets, and our job is to figure out what they’re doing and then catch a ride on their bus.
If the Dow closes up for the day I will get a sell signal. The last one was on 1/5 and worked within 2 days.
WTF was that? Amazing moves….
thank you DG…will see if DOW closes +ve
it’s gonna be close…
That 25 minute spike at 2.55pm was very impressive. The last 5 minutes of that shot the Dow up to exactly even and then dropped 30 points in less than 1 minute. How do you beat that?
Hey DG…
No +ve close…
Some interesting analysis:
http://rosenthalcapital.com/blog/
Nike: Yeah, close but no cigar. Oh well. Doesn’t mean we won’t go down, but the signals give great entry points. I was ready to take a pretty big shot.
Gary,
Based on your cycle analysis of the IT and the dollar three year low (or any other tools) what is your best guess when this C wave will top (roughly) and how do you analyze this ques?
Thanks in advance
Hi DG,
yea..thank you for posting..I was gonna take a position too..was all set to hit the “Place Order” icon …didn’t tho cuz you said positive close
IMO, initiating a position today wouldn’t make much sense. Very unlikely to have any big moves until the fed anouncement tomorrow, and after the announcement we will probably have the famous “running the stops” action. Shorting at a marginal new high tomorrow, after the anouncement, would make a lot of sense.
why isn’t the Muni Bond Crash in the news yet… ?
Nike: I can only get a sell on an up day and buys only happen on down days. Remember, though, the buys are amazing and the sells are just good. If the conditions are right I bet the house on a buy. Given the momentum of this thing I’d have taken only a modest additional short position. I am already lightly short.
“News” is propaganda, if you get it from your boob-tube. 🙂
Shalom Bernanke
shana tova,
then who is the propaganda working for…
Gary,
No one on the this blog has talked about shorting this market today. With this second push up can one safely take a small short position here? Not knowing what tomorrow will bring, thought I would ask.
Oh you just had to ask that Golden, didn’t you!
Methinks our long-awaited bottom comes next week at XAU 185ish. I think I will cover my S&P shorts and buy miners there, and AGQ a few days later.
I suspect that the massive S&P correction we’ve all been waiting for will not come as a sharp decline, but as a slow, grinding rollover. The real fireworks will start this summer.
Hi DG…
yea was gonna take a small short position as well..just until the intermediate bottom in gold..was kindaa getting bored twiddling my thumbs…From december to now, I’ve not done any trading (waiting for the market to top and/or gold to bottom)
my patience is really getting tested as gold still hasn’t gone below 1300..looks like it’s gonna be a few more weeks as Gary says…
hopefully I can do some successful swing trades while we wait
Poly
I’m new hear, many respects the veterans. My short experience of the market has shown me that it is at market extremes that the propaganda nature of “news” it at it’s best. The fact that they didn’t talk about the Muni crash is a sign of complacency IMHO. So i went out and loaded a fun postion of 3% of my portfolio on at the money feb put on the S&P.
“then who is the propaganda working for…”-Golden
Why, the people who own it, of course.
Good luck Golden.
I’m with you there, although I now have the “Garage + 2 sports cars” on similar trades. I’ve given myself a little more time that Feb though 🙂
we need to have patience now…no need to dip our hands in the cookie jar just yet
Poly,
true feb is bit short, i sold most of my PM postion into strength with GDXJ between 38 and 42, now all i’ve got left are looser who won’t get bashed much more and too latre to sell anyways… IMHO the correction in stocks has already started and it has to be a steep one cos all my contrarian indicators are in the danger zone. I made 40% on the way up since august in PMs. I started loading on put 1st of January, and plan to do that at a speed of 3% a month. so far I lost her 3% in january, plan to laod 3% again in march, or probably roll over to march soon if the crash doesn’t come before en do of feb..
It always takes longer to eventuate, I rolled some Jan’s over and then some Feb’s, at one point thinking Feb was well in the timing band.
FYI – Haven’t seen ANY mention of it for a very long time, but one of my saved charts is the once famous Baltic Dry Index. Anybody seen it lately? It’s a VERY sick puppy.
http://stockcharts.com/h-sc/ui?s=$BDI&p=D&yr=3&mn=0&dy=0&id=p53234713132
Very interesting chart on the long bond:
http://img121.imageshack.us/img121/9788/tltl.png
Everyone is talking about the death of bonds. I am not so sure. sentimentrader shows bond sentiment at a bearish extreme, and look at this chart. Something that is hated that shows a positive MACD divergence and then breaks a downtrend is worth considering. I do believe bonds are in a new bear market, but that doesn’t mean we can’t have large enough rallies to convince people “everything is fine.” Maybe we go back to stock tank and dollar and Treasurys go up. I love the line, “The market always does *what* you think it will. Just not *when* you think it will.”
Afternoon browsers and Fibonacci lovers:
http://www.youtube.com/watch?v=kkGeOWYOFoA&feature=player_embedded#!
DG, Bonds are in the timing band for an intermediate low.
POLY
That was great- I have seen so many things about Fibonacci in natures patterns (Pine cones , sea shells, flower patters, etc).
THANKS FOR THE CLIP
Rod,
There is no such thing as a safe short position in a cyclical bull market.
Steven,
I expect the c-wave to top when the dollar’s three year cycle bottoms, sometime between March and May.
You all can pretty much count on the d-wave starting last week of March-First week of April , because…
…My wife ALWAYS LIKE CLOCKWORK plans our vacations at the TOP of a c-wave. No joke,I am on an Island every time. 🙂
If we chop around in Feb (assuming overall market weakness) would that give us enough time for a huge C-wave top?
Brian (or Gary) What’s the IT cycle length for bonds?
Hi Gary,
You mentioned that you want to wait for the intermediate cycle in stocks to be over because that will drag the miners down with it
Since stocks have been outperforming gold for the last 2 months (especially in Jan), is it possible to have a swing high in stocks and the swing low in gold/miners at the same time..maybe in the next 2 weeks?
Seems like we will barely have undone the damage from this correction by March.
Gary had previously projected a C-wave top in June, along with some very ambitious price targets (1800-2200). Right now I hear people calling for $1600. Are we pulling in our horns?
I know I’m feeling a whole lot less bullish. SLW at $40 feels like a long time ago. If only we could get a few trolls around here…
DG, 21 wk avg that varies between 16 and 28 according to the Cyclesman. Last one occurred in Sept and is extremely left translated. Clearly any further strength this week will mark a weekly swing low. Gary may have thoughts about these bands.
DG, Keep in mind, you have a left translated seasonal cycle working along with that left translated int cycle. Gary has mentioned several times about the probable end of the bond bull and the Bond King has said so much himself.
Actually in several recent reports I have speculated that one more leg up of similar magnitude as the first two would take gold to $1650ish.
Nike,
I think it’s very possible that gold bottoms (temporarily) and stocks top. Money comes out of stocks and flows into the PM sector.
However when we get a final selling climax into an intermediate cycle low for stocks it tends to pull everything down. I would expect that to drag miners and probably gold back down one more time into a final low later in February.
Are you still expecting silver to challenge its nominal highs at $50?
Thank you Gary…
sorry ,follow up question – so the intermediate top in stocks and the intermediate bottom on gold can’t happen at the same time?
both the intermediate bottoms will happen at the same time?
David,
I won’t be at all surprised if it does.
Nike,
I expect them to bottom fairly close. Gold might bottom a bit ahead of stocks but miners will probably get dragged down during the final selling climax.
Gold at $1650 and silver at $50 is a ratio of 1:33.
I guess it’s possible. The ratio is 1:49 right now, but it went from 1:66 to 1:46 from August to December. It could plausibly go from 1:50 to 1:33 by spring.
It does make me ponder switching my GDXJ assets into AGQ, if that’s where the action is going to be.
Per Zero Hedge, Marc Faber thinks the USD and Treasuries are the best places to be for the next 3 months (!!)
Yikes…I hope we don’t have to wait that long to get back into silver.
“In the long-run, for sure US Treasurys and most government bonds are a suicidal investment. But as a shorter-term timeframe, and I think for the next three months or so, I think we have a situation where stock markets have become very overbought, and emerging markets in January, most of them failed to make new highs above the November, December highs, and recently some of them have sold off very considerably, plus the Chinese market is giving you a signal that something is not right in the Chinese economy, because it is going down. For the next three months you have to shift out of the Emerging Markets, they may correct 20-30%, out of industrial commodities, on a relative basis. And I think the sentiment, just recently, was overly optimistic on the reflation trade, and overly negative about treasury bonds, so treasury bonds right now are oversold, and as of tonight I got the buy signal on US Treasurys. I think Treasury are the best place for the next 3 months, as is the US dollar. I think a correction is coming in the range of 10% in the S&P and 20-30% in the emerging markets.”
Curious about what, if anything, might be read into the Monday CME futures report, which showed an eye-popping reduction in OI for gold at most deliveries. The reduction for silver wasn’t on the same scale.
http://www.cmegroup.com/daily_bulletin/Section62_Metals_Futures_Products_2011015.pdf
Obama – “We are poised for progress. Two years after the worst recession most of us have ever known, the stock market has come roaring back. Corporate profits are up. The economy is growing again.”
Incredible that the President is giddy because of stock prices being higher. Bernanke and Greenspan are also giddy about higher stock prices and are convinced that high stock prices will help improve the economy.
Are they ever going to let the market have a REAL correction again, or will it just keep melting up thanks to the magic of QE2?
FYI… tomorrow night is options expiry on the gold contract.
The oilprice didn’t inflate upwards as claimed QE2 would do. Several months after it started the oilprice is only about 1.5$ higher than on Nov 3rd!
catbird,
I also like and respect Marc Faber as he tells the truth and gets the big picture correct. But with short term prognostications, I’m not concerned if my views are different than his as his timing is frequently off.
Shalom,
True, like anyone else Faber is hardly infallible when it comes to short-term price predictions.
Apparently Faber also expects gold to correct 20%, which would take it down to about $1135 from its $1420 high.
I think Gary’s expectation of an intermediate bottom in a few more weeks (around $1265ish) is more believable when we remember the USD is due to take a big puke this spring.
Shalom, following your personal opinion about Gold´s bounce, where do you think it will rebounce ? $1.370 ? $1.400 $.
Thks.
Gary wrote: “Steven,
I expect the c-wave to top when the dollar’s three year cycle bottoms, sometime between March and May.”
Hi Gary, didn’t find a USD chart on the premier website showing the 3 yr USD cycles, so I was just wondering what the main rationale is for the USD making a massive new low this spring?
Is it because it’s in a failed/left translated 3 year cycle?
Thanks
Ollie,
The last three year cycle low occurred in March of 08. It’s due again between March-Sept of this year. The most likely bottom should occur with the current intermediate cycle which is due to bottom between late March – early May.
I have no idea Carlos. I try to focus on direction more than specific price levels. If gold doesn’t bounce strongly out of this decline then we probably have a good amount of downside left.
This much anticipated bounce will tell us a lot, whether it’s met with selling or can stay elevated. From the looks this morning, the bounce hasn’t started yet.
Thanks for your thoughts Shalom.
Thanks Gary, but why can’t the USD just, say, bottom here?
Why do you think it will make a massive new low?
I mean it’s been making higher lows since ’08?
Thanks
Well it can’t bottom here and make a three year cycle low. The last major intermediate low occurred in Nov.
That occurred 6 months too early as the timing band for the three year low doesn’t begin until March. That makes the odds very low that Nov. marked the three year cycle tough.
New Post
IMO, the daily DJIA appears to be a parabola which is as of today bent more vertically. When the angle of ascent increases, one takes notice.
Based on my meager backtesting, what I call the wide W reversal back in 09, which could be seen as an H&S in 08-10 on a daily basis, is just now completing by the rare but yet historically real blow off rally.
14000 is a resonable projection, with 13000 pretty much in the cards. The next few days will tall what’s what. That would also whack gold, btw, as all eyes will be on the feeding frenzy. Irrational exuberance just changes ponies; it doesn’t go away. Only a shotgun blast to humans will make that puppy leave the stage.
Gold and silver, maybe, but I think it’s just the dumping of money by the feds that’s filling the equity inflation stocking. And this long rally, seen only a few times before in the 5 min and longer S&P has today captured the thrill seekers and blind greed is imo about to enter the stage in that one, just as it did in silver and gold. Is it time to shift musical chairs?