Strictly Necessary Cookie should be enabled at all times so that we can save your preferences for cookie settings.
If you disable this cookie, we will not be able to save your preferences. This means that every time you visit this website you will need to enable or disable cookies again.
Inflation? Unit Labor Costs -1.0% vs. 0.0% consensus today, Oil heavy oversupply, expect more deflationary flows with the QE hangover yet to kick in data wise. What is your thesis for inflation? Also do you have anything to suggest USD is topping other than negative divergence on RSI? This seems a very narrow analysis.
I agree, Steve. Looking at the chart for the $USD, I would be an aggressive buyer of it here as it is continuing to breakout into Bluesky, with no overhead resistance in the near term. That is, if I were a FOREX guy, which I am not. I just don’t see the case for the $USD showing any real topping action at this point either. Even the fundamentals continue to support the higher $USD and I am very weary of the PM market at this point in time. I see $1000 gold as a strong likelihood in the next 3 months.
The dollar has rallied hard for 7 months and now you want to be a big buyer?
You’ve got to be kidding. The time to buy was back in May.
I never buy anything that has rallied for a long time and stretched far above the mean.
Subs were begging me to buy platinum back in July because all they could see was upside to infinity. I refused to bite. That turned out to be a wise decision.
The way to make money is to buy at bottoms and sell as close to the top as possible once they stretch above the mean. This is what professional traders do.
Retail traders do the opposite. They buy at the top because they think the trend will continue indefinitely and they sell at bottoms.
Steve,
A very stretched intermediate cycle and approaching 200 month moving average for both the euro and dollar.
Gary so far SO good: http://stockcharts.com/freecharts/gallery.html?s=gld
It’s been now a month rally and thus far NO NEW 52 week closing low like the “old days”……. thinking a NEW paradigm shift in the making. As long as GOLD $1195 threshold holds, we will be just fine.
Silver SHOULD follow sync.
Oil on the other hand is playing a “dicey” hand and with her “gap” NOT filled like that of gold and silver, I would play this as a speculative investment with keeping an eye on $66.61 as another “ejection threshold”.
FWIW — M.D.Cov
I’m just watching gold closely here. It needs to break out above the high of the engulfing candle. If it doesn’t do that soon then I’m going to go on high alert that the powers that be may try to cap price below that level and artificially extend the intermediate cycle.
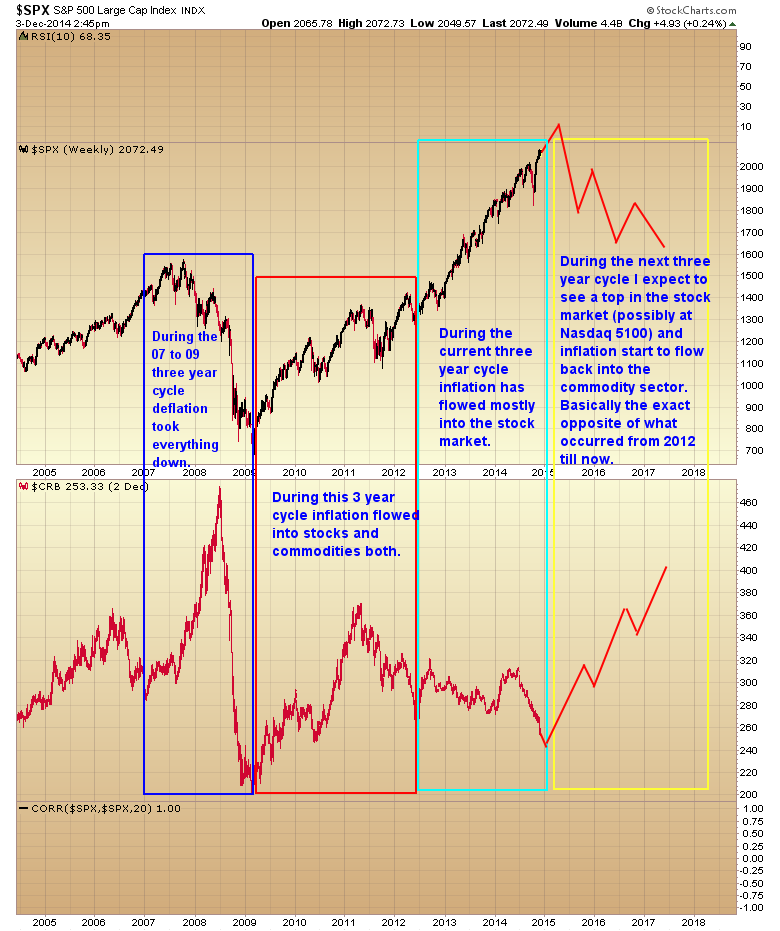
With a blowoff rally in play until 5100 for the Nasdaq, how long can it go if comparing to mid to late 90’s? The PE ratios would need to double and 30 year yields would have to be such that aaa bonds are selling at a discount and ytm north of 6-8%. How is today similar to that time period if we have constant QE keeping rates and inflation down? We would have to see 20k plus in the Dow, 2500 for s and p, and 7k for Nasdaq. Your prediction sounds great but could be a 2-3 year playbook. I see gold at 600-700 and oil at 30-50 if we have a sustained equity rally that is strengthening the usd. Thoughts?
I’ve noted that a bubble phase usually lasts about a year once the public starts to pile in. One could argue that the bubble phase began at the Oct. bottom so by that measure we could still have a ways to go. On the other hand the market is already stretched quite far above the 200 week moving average and clearly forming a parabolic move. If the Nasdaq were to surge very quickly to 5100 it could be enough for the market to top and the next bear begin.
Did anyone else notice the manipulation at the close yesterday on GDX, where they spiked it down and grabbed the stops, all the way down to $17.72, or is that an error on my charting system?
It was probably a mistake as someone tried to fire off an order right before the close and probably hit one too many zeros.
Gary.. I did laugh reading your reply… do you really meant that??.. that guy must have hit his head hard once realizing…
Gary looking at the dollar chart it appears two trading sessions ago she was on a “bonafide breakout” however TODAY she again is at that crossroad mark……. chart remains bullish, what do you think?
Today:
Bought a large position in a BRAND NEW equity which is in EARLY stages of a “breakout”.
Sold my oil ETF BECAUSE oil BROKE $66.61 and FLIPPED gears into the opposite cousin of a short oil ETF (yeah I know kinda late to the party however the chart TOO is VERY bullish).
HOLDING gold and silver ETF at the moment.
Got my eye on another past holding of mine which is ALMOST at a buying juncture.
FWIW — M.D.Cov