Strictly Necessary Cookie should be enabled at all times so that we can save your preferences for cookie settings.
If you disable this cookie, we will not be able to save your preferences. This means that every time you visit this website you will need to enable or disable cookies again.
On the DAILY gold chart you can see a HEAD and SHOULDERS pattern,
and normally these preceed a drop in price. We think there is a fair
chance of going back down to the lows seen in AUGUST 2015.
On the weekly chart that goes back to 2013, that gold
has been in nothing more than a NICE DOWNWARDS channel, with
the expectation, if this trend or pattern continues that GOLD will
continue to the support target on the WEEKLY to about 1040 mark..
Based on that I Took NUGT few days back at 2.91 and sold today at 3.01
Took the proceed and bought BTU.
Global indices at a glance…
https://www.linkedin.com/pulse/global-indices-where-we-william-yii?trk=prof-post
most likely I am looking for at least S&P1833 if not lower within a week.
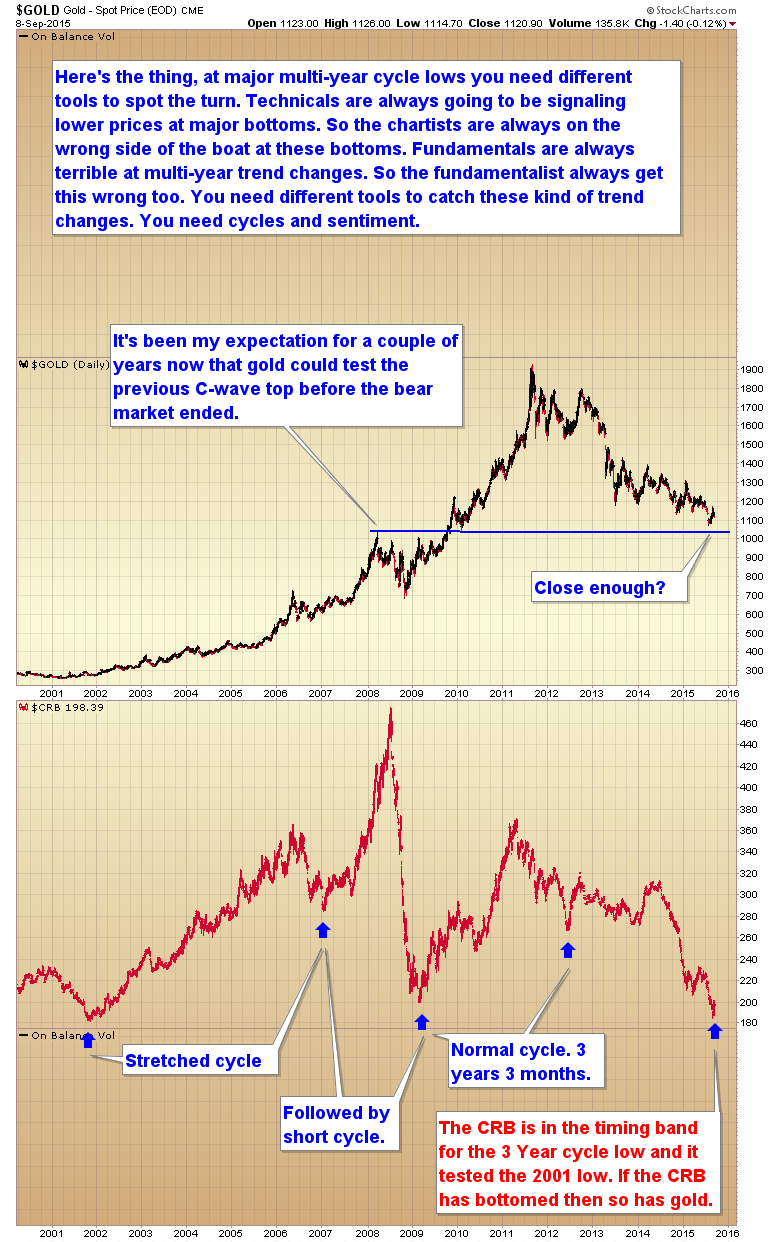
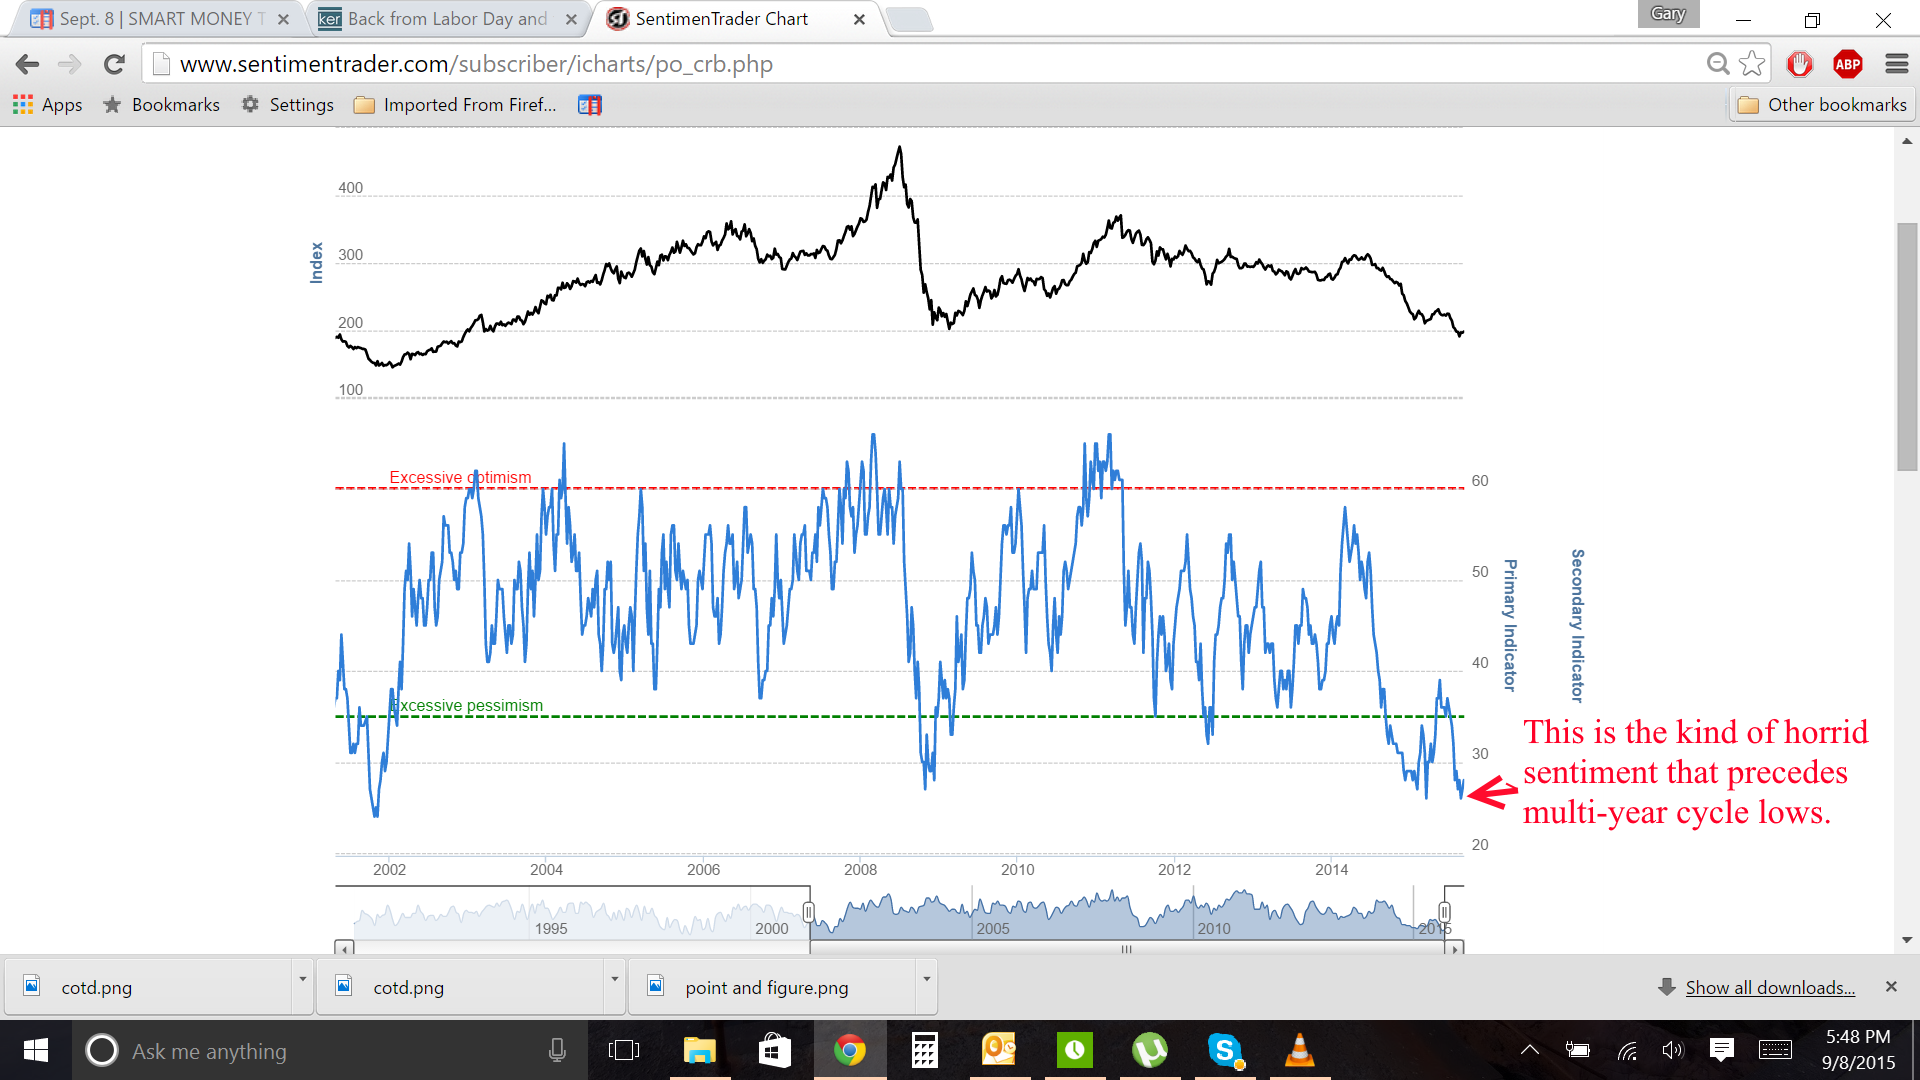
Good stuff Gary. CRB is at 40 year strong support at 185-180. I doubt it will break and if it would it would most likely be false break down so i would argue CRB has bottomed.
Here is another chart to collaborate what Gary is saying.
http://www.graceland-updates.com/images/stories/15sep/2015sep8crb1.png
You weren’t expecting the CRB to crash like it did.
http://blog.smartmoneytrackerpremium.com/wp-content/uploads/commodity-bull.png
Asian markets have gone crazy tonight.
It’s really only NIKKEI which is on a technical bounce as it has dropped 3500 points in a month! Hence the +6% rally today.
The HK and China(+2%+ each) are just moving higher in sympathy with NIKKEI.
Remember that bear markets have no long term support. The support that matters is the one that holds and that will only be known weeks after the fact.
http://schrts.co/6Ua1k9
Gary, supposing the bottom is in, how high do you think gold will realistically go? Over what timeframe? Thank you.
When the third leg of the bull starts I think it will get to at least $5000.
Now that we have a daily swing low in place for $HUI we should see a clear and convincing break of the downtrend line from 133.11 in tomorrow’s trade with gold rallying out of its DCL and the $USD falling into its DCL. Getting three straight up days of 3-4% or 3-White Soldiers to replace the four consecutive BRD (Big Red Down) candles or exhaustion candles to 104.94 or the successful retest of the bear market bottom printed in early August at 104.66 once 133.11 is taken out we’ll see more shorts cover and sideline longs chase the tape higher and the secular bull trend resumes. I went in full strength on Friday’s intraday lows so not much to do, but sit back, relax and watch the gains pile up! ?
They are already trading lower.
The trend of QE has created inflation in the stock market and housing market and deflation everywhere else. I don’t see how commodities can rally until the qe is halted and interest rates rise.
Ha?!
Gary,
Gold and oil, but specially gold is going in the reverse direction today. What gives? It looks like it wants to go below 1100 again.
Clive Maund and others are of the conviction that a 2nd leg down in stocks is imminent. If so, could we expect gold to shoot up to 1200+ if this scenario unfolds?
Government PPT is doing its best to pump up stocks as we witnessed on Monday night and Tuesday. I think they want to make it easier for the Fed to hike.
If the Fed hikes, will that not be pushing gold and oil downward?
Careful not to bloody your hands as you attempt to catch this falling knife!
Hope you decided to cut losses on miners. Glad I bought JDST yesterday. Commodities will bottom soon, but probably not before the last of the gold bulls are shocked.
Wake me up when Gold is below $1000 🙂
Odds are that we got the daily cycle low in Gold today.
Not
Switching to SHORT positions in both gold and oil now. Today.
Sorry Gary, the rallies just did not come soon enough for me in gold and oil. Seems gold is headed to 1079 and lower thru November. And oil is headed to the 30s again.
You missed your chance , why would you short now lol some people just like throwing money away I guess, you should be taking a long here lol
OK you go long then here and throw away your money. Some people don’t know when to shut it I guess.
Careful, the JDST rocket ride could just be getting started. When short QQQ this afternoon as well.
PPT bastards failed this afternoon, market plummeting into the close.
Good for You Dan. 🙂 I am with you on both trades.
Yes I think what happened was the bears were bamboozled by PPT starting really Monday night: classic strategy of market manipulators is to start in weekend Sunday night or in this case Monday night after a 3-day weekend. They hoped to set the tone positive for Tuesday market open in NYC, and they succeeded on Tuesday to push back the rolling rock up the hill by 400 points.
But by today, Weds, the effect of the PPT morphine wore off in mid session and a reversal took the Dow down peak to trough around 330 points.
The Key now, IMO, is Dow 16,000. The bears failed to close under it twice last week. They must close under Dow 16,000 while they got the momentum or else PPT will steal the ball and run with it again.
On gold, I agree with you it seems ready to fall under $1100 again. Perhaps to 1079 and then lower. It has until end of November to bottom still.
Mighty H&S pattern…getting more interesting by the day…
https://www.linkedin.com/pulse/golds-hs-dripping-game-continues-william-yii
Wow, what a distinct and clearly defined H&S pattern!…Thanks for the article William.
The peak to neck is around $100 isn’t it? If I take that and invert it from the neck line I get something in the 1020 range as the target? Am I right?