Strictly Necessary Cookie should be enabled at all times so that we can save your preferences for cookie settings.
If you disable this cookie, we will not be able to save your preferences. This means that every time you visit this website you will need to enable or disable cookies again.
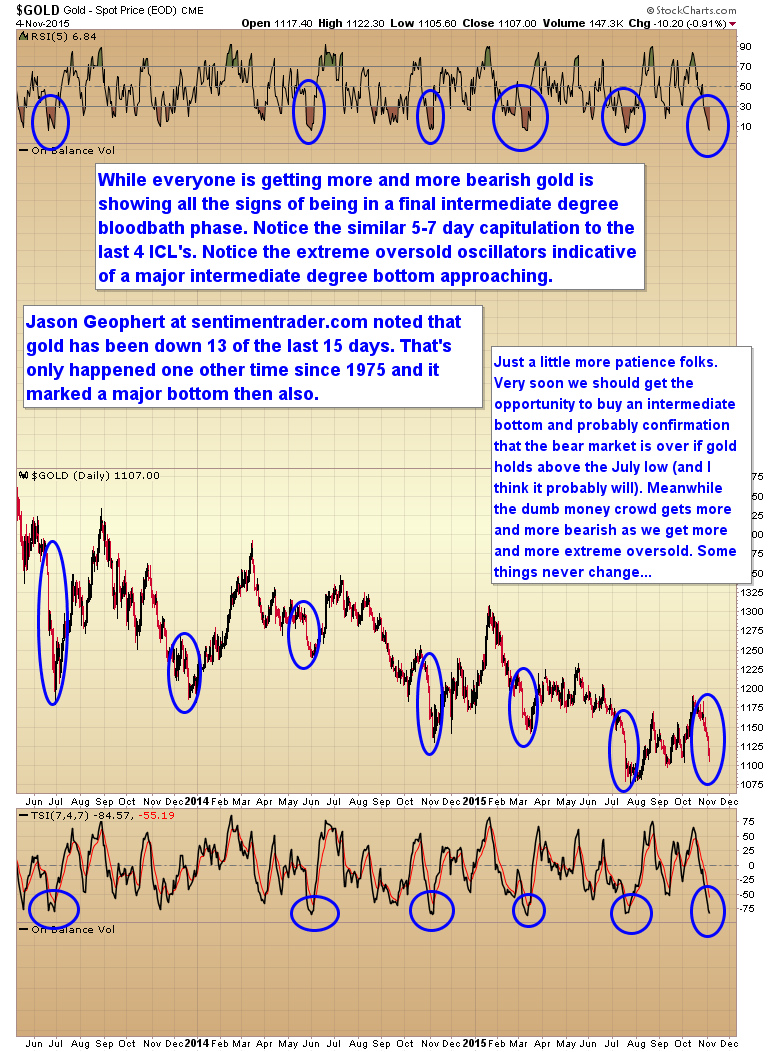
For a more indepth review of the long term implications of this kind of panic and why I think gold may be about to form an intermediate bottom and not just a smaller daily cycle bottom see tonights report.
I think there is a 50/50 chance you’re onto something with respect to a shortened IC. It’s a coin flip and would take one hell of a bad jobs print this Friday. Markets always attempt to discount future expectations/returns and the biggest gains are often made going against the grain. That said, I wouldn’t gamble w/ the probabilities that the USD is getting ready to breakout of a triangle consolidation for a rocket launch to the 120 level on the DXY. The dominant trends matter and despite having called a bear market bottom I think most if not all gold/silver miners will be bankrupted before the next leg higher in gold’s secular bull market. It’s a hell of a lot cheaper buying gold/silver in the ground long after equity holders have been destroyed. ?
USD will go to 90 before it ever goes to 120.
Oh I don’t know that it would have to be horrendous just in line with the weak trend over the last three months. I think anything under 175,000 takes a rate hike off the table for the next five months at least.
Mr. Savage are you thinkin undercut low coming into play aka sub $1103.80? Me thinks so could happen as early in overseas trading/Wednesday. Gonna nibble on a limit chunk of ABX for sure.
Energy to me still looks strong and taking a momentary breather.
FB looks ripe for another technical breakout as well.
PS Shanghai rockin for second straight session and should help propel the commodities and US markets going forward IMO.
You might want to wait just a bit longer before buying. At least wait for gold to make a swing.
Gold could bottom any day now, if it hasn’t already, but still not too advisable to try and be a knife catcher! 🙂
https://pbs.twimg.com/media/CS_Hst_WoAA63Yx.jpg
Thanks Gary
AlexP and I have been looking for a DCL in precious metals this week — and now that the intermediate trendline in gold has broken, that would double as an ICL. Miners, in particular, have looked like they were in consolidation the past few days, prior to one final move down in the DCL.
Jorgy,
So far, DXY is still contained within parallel lines, but it’s right at the top of the channel…
https://www.tradingview.com/x/zksrdepY/
Thus, the move up in USD since Aug 24 looks like your garden variety corrective move, unless the channel gets decimated.
I don’t see the triangle you’re referring to in DXY. So while I agree with you on a DXY breakout, I don’t think we’re quite there yet…
As for jobs numbers, I’m getting the feeling that we’re entering into a period of continued low new jobless claims numbers on the weekly Thursday reports, that more recently are combining with less new jobs in the monthly NFP reports.
So looks like I’m on the same page with Gary here 🙂
Turn off the daily and weekly charts and l@@k at the monthly. The USD: http://finviz.com/futures_charts.ashx?t=DX&p=m1 had better turn down fast, don’t worry, its not, otherwise the commodity complex will take out their 2015 lows. The FOMC wants to raise rates in December which is why we won’t get a bad jobs # on Friday. Gold will print a swing low tomorrow, suck in longs ahead of the Friday non-farm payrolls # and turn flush everyone who has bought in 2015 and holding on for dear life trapped long from 2010 to the recent highs. The bloodbath in natural gas will have nothing on the catostrophic losses in the commodity complex. The super cycle topped in 2011 and it’s time to go to sleep until 2030 at the earliest! ?
In relation to the Dollars’ bullish consolidation pattern (so many referenced in Gary’s last thread) remember there is a far higher failure of those patterns at tops and bottoms than normal. Not saying it’s certain, but thought if worth mentioning for those learning.
You sure Gary..?
Please check and re-check your crystal ball cuz we got a bunch of whiny little babies that could turn around and start throwing daggers at you if you don’t smarten up and all 🙂
Jorgy,
Thanks for the monthly chart! I look at that on weekends, but haven’t extended it back to 1986. Looks like that multi-decade move down is nicely contained within parallel lines, just like the recent multi-week move up.
But I’m still not seeing a triangle. When did the triangle begin?
If you’re referring to the consolidation since the March highs, if it turns out to be a triangle, we’d have wave A down, 5 months in duration, to the Aug 24 lows, wave B up in progress — a long way to go for a triangle to complete, perhaps a couple of years.
If you think of that in the context of a 20 year move down in gold from 2011, good chance there will be a couple of multi-year counter-trend rallies in gold — one in the mid-2010’s, another in the 2020’s. Probably another one right in between — 2021 anybody?
The awakening of Dragon…and the final decision (by this month) of Chinese RMB’s inclusion to the world reserve basket would really propel the bull.
https://www.linkedin.com/pulse/chinas-awakening-bull-william-yii?published=t
DXY’s monthly chart “looks” like a breakout now…but, don’t forget, we are only into 1st week of November. This breakout here needs to be able to sustain till the close of the month…else, it could well turn up to be a monthly “hammer” instead!
William,
DXY needs to clobber the upper line of this parallel channel before it’s a breakout:
https://www.tradingview.com/x/NCkrl4Ia/
Until then, it’s still in a corrective move.
One suggestion that might help with probability assessment is to ask yourself:
Is the market I’m looking at trending or correcting at present?
William,
PS: Waking up at 3:30 a.m. to watch the market close is a heck of a lot harder for me than waking up at 2:30!!
ehhh…you’re just 1 1/2 hours behind me…hmm..where are you i wonder?
Gold at such oversold levels, a sharp drop since 7 days ago, is worth an attempt to get long for a bounce. It’s not a level to get short. But the bounce, its too premature to conclude end of bear market. Imagine, if you heed Gary’s advice to get long, traded it when you see such high COT last week, then buy back now. This would have reduce your buying price.
Gold is a trade, until its moving averages all point upwards, its better to trade it than to buy and hold.
Dxy could move up or down short term but the key qn to ask is if it is up trending towards 120, or have we seen the highs. If latter, good for gold. If former, what happens? 1999 provides clue. People will chase dollar assets on dollar strength. Biggest bull? Tech stocks. Commodities weak.
In 1999, if you follow Dow theory, you were a fool. Transports super weak, but Nasdaq super bull. The same may happen now.
Another qn to ask is if you wanna fight the FED? Do you think stocks bull market is over with such low rates? I bet not. If so, FED would be out of job during the next bear. So likely scenario, stocks as in nasdaq bubble phase on dollar strength, enabling FED to raise rates down the road. Commodities? Lackluster.
Gold tends to move down in A-B-C patterns. After A down, bargain hunters are tempted in since price is so much lower than just a few days ago (wave B). Then ‘C’ concludes far down to the final bottom.
Tomorrow’s payroll report could possibly be strong since in October activities are in full swing after the vacation, it is neither too warm nor too cold for outdoor construction work, the agriculture harvesting is peaking etc.
However in November frost and snow prevents much outdoor activities including mining in adverse areas etc, the harvest is over + a strong dollar is reducing the US competitiveness, therefore the beginning of December report might be very weak, providing the Fed with a no-hike excuse.
So ‘wave C’ could start tomorrow morning.. The gold purchasing in India will also begin petering off in a couple of days
William,
Thailand. I set my alarm at 3:30 & try to quickly catch up on what has happened since going to bed, and decide if I think a market move has a high probability or not, and if so, at what degree.
These days, I’m focusing on probability assessment.
??????
The smoking gun was the COT report that was posted last Friday. The last time it was this bad was last February. Gold dropped about $150.
http://snalaska.com/cot/current/charts/GC.png
Nice chart with many good reasons reasons to buy buy buy. But here’s one very simple chart that shows gold has been in a downtrend for years.
The 200 day moving average.
http://schrts.co/yCrwcs
Monthly chart of gold with COT in lower pane.
Does not look good for the Bulls.
http://finviz.com/futures_charts.ashx?t=GC&p=m1
For those who are fighting against the stock bull market, you may wanna consider the following. NDX 100 could be the new Dow. More people are embracing technology. It’s across the world that you either use Microsoft for work, use Apple phone , or an android phone, search using Google, bcos times are bad, you shop more online hence using Amazon, watch movies online using Netflix and most importantly, gossip and voyuer on Facebook.
The productive capacity of US is just so great. Take note also that Internet of Things is taking shape, further making NDX the new Dow. So the qn is how high could ndx go. Well, taking cues from year 2000. Then the Dow to NDX ratio was around 2.4. With the Dow currently at 18k, ndx could easily be at 7500! Also, from the chart, Dow looks like its heading towards 23000. If so, ….you do the math yourself.
That’s why Gary is very likely correct to say that the stock bubble phase is only just beginning.
This week we have the most Fed speakers (13) scheduled in a single week for the whole year . Why? .,
They usually wheel them out to counter bad news , Something is in the wind
Watch closely
feels that way…hawkish one minute dovish neg rates floated the next minute.. when will the market
catch on…? (confidence) lost…
My guess is the jobs number will be weak again for the third month in a row.
Wow…Royal Gold loses 12.5% tday..anybody any idea why ?
Cannot eat gold.. need cash for food
Gary, I’m surprised you’re not giving more respect to what the COTs are telling us. When do major intermediate bottoms take place with the commercials this short? As I see it, a brief daily cycle bottom is probably the best case scenario, unless the COTs change drastically this week.
By my calculations, we have a BLEES of 21, as of the most recent COT.
Seems like the whole talk about whether gold or miners leading prices up or down is just an alternating game of cat and mouse – gold drops a lot, miners can be fine, gold prices stay put more or less then miners are smashed tonight.
big boy can do whatever they want
Looks like they will sell miners right into EOD
I’ve been spreading this one around, so may as add here.
China’s SSEC index went parabolic earlier this year and now is sitting on the RS of an 18 mn H&S. China’s New Year is Feb (monkey), what do you think – tax loss selling or buying? Same for miners into year-end (Jan – US).
Believe it or not! Gold seems to lead Shanghai by a few weeks, so SSEC bottom in Jan = bottom in Gold Dec.
http://stockcharts.com/h-sc/ui?s=%24SSEC&p=D&yr=1&mn=0&dy=0&id=p91988805101