Click here.
Monthly Archives: July 2016
CHART OF THE DAY – NEW HIGHS
NEW HIGHS
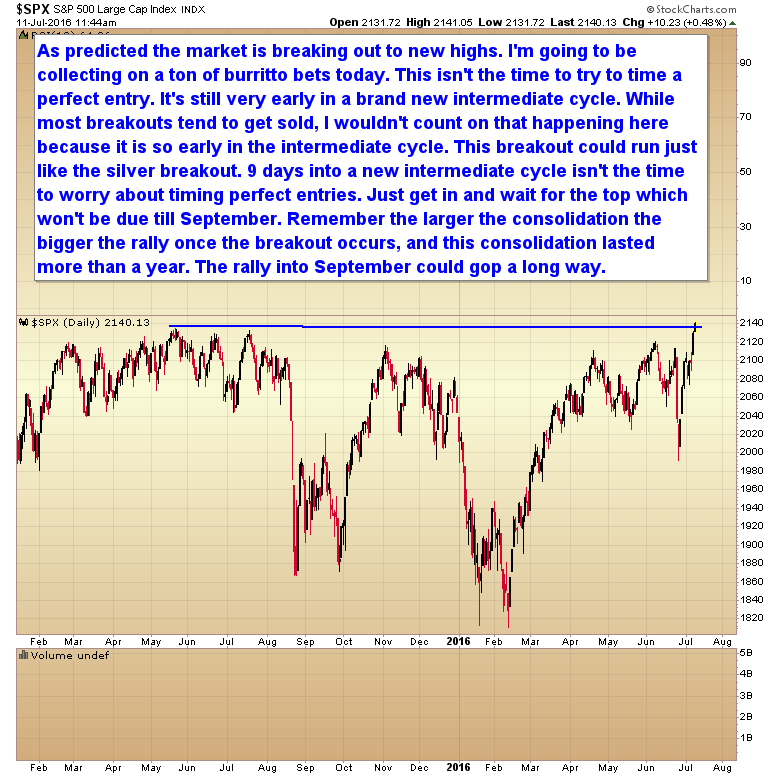
As predicted, the market is breaking out to new highs. I’m going to collecting on a ton of burrito bets today. This is not the time to try to time a perfect entry. It’s still very early in a brand new intermediate cycle. While most breakouts tend to get sold, I would not count on that happening here because it is so early in the intermediate.
This breakout could run just like the silver breakout. 9 days into a new intermediate cycle isn’t the time to worry about timing perfect entries. Just get in and wait for the top which won’t be due till September.
Remember, the larger the consolidation, the bigger the rally once the breakout occurs, and this consolidation lasted more than a year. The rally into September could go a long ways.
Like our new Facebook page to stay current on all things Smart Money Tracker
CHART OF THE DAY – GOLD & THE DOLLAR
GOLD & THE DOLLAR
While I’m expecting some kind of pullback at the $1390-$1400 level, I don’t think gold’s intermediate cycle will top until at least retracing the 50% Fibonacci level and probably back to $1550 by September. This will almost certainly be driven by an aggressive moved down in the US Dollar as it really starts to accelerate into the next 3 year cycle low due sometime net summer or fall.
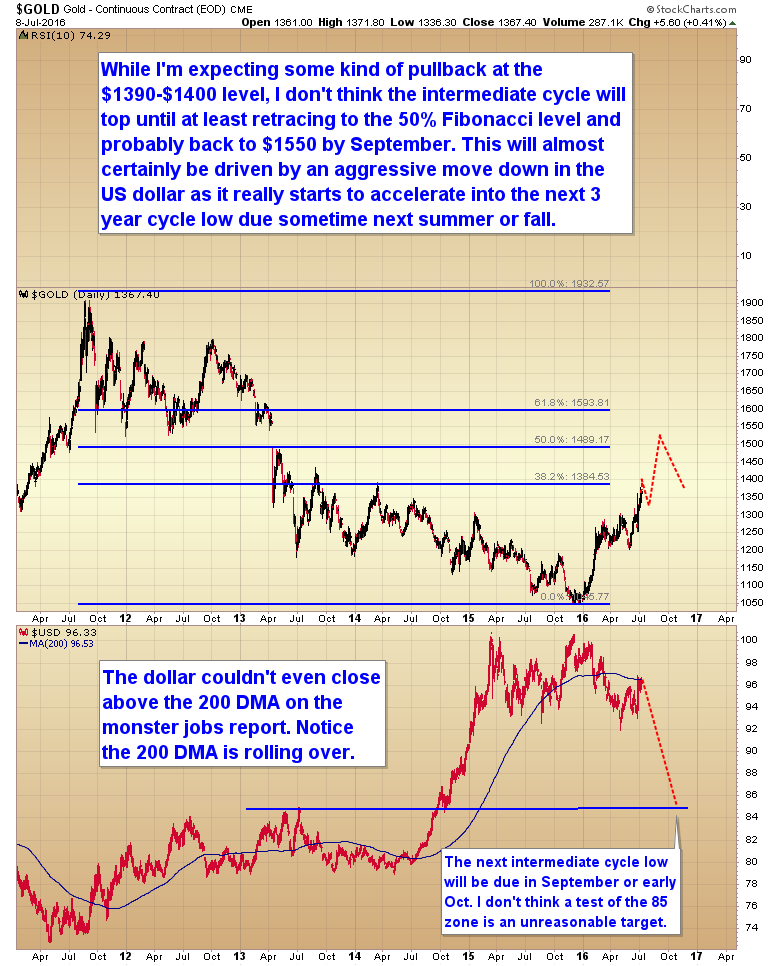
The dollar couldn’t even close above the 200 DMA on the monster jobs report. Notice the 200 DMA is rolling over.
The net intermediate cycle low will be due in September or early October. I don’t think a test of the 85 zone is an unreasonable target.
Like our new Facebook page to stay current on all things Smart Money Tracker
INFLATION – DEFLATION
INFLATION – DEFLATION
I listened to the debate between Rick Ackerman and Mike Shedlock on the Kereport today and I wanted to comment on the inflation side. We have a perfect example of two analysts locked into the deflationary crash scenario by what happened in 2009. Both are deflationists and both have been wrong all year long, and basically wrong since the bottom in 2009.
I’ll say it again: In a purely fiat system there is no level of debt that can’t be inflated away. We proved that in the 70’s when we inflated away the Vietnam war debt.
Let me paint a picture for you. Let’s say you have a printing press in your basement and have unlimited access to ink and paper. Explain to me how you can ever get so deeply in debt that you can’t fix the problem by simply walking downstairs and firing up the press.
Essentially that is what the government does, and they don’t even require any paper or ink. The money is created with a keystroke.
In this environment deflation is a myth and it’s why these guys have been wrong for years. They simply refuse to walk down the stairs and see the printing press for themselves.
In a purely fiat monetary system deflation is a choice not an inevitability. If a country is willing to sacrifice its currency then any amount of debt can be inflated away. It doesn’t matter how many trillions we are talking about. At any point in time the government can simply mail checks to its citizens. Never happen you say? For all practical purposes that’s exactly what we did in the spring and summer of 2008 with the rebate checks.
Mike says that stocks are in a bubble. I had to laugh when I heard that. A bubble is characterized by price stretching 50 -100% above the 200 day moving average and rising at least 100% in a year or less. It is also characterized by mass participation by the public.
Have any of those things happened in the stock market yet?
No, we aren’t even vaguely close to that yet. It will definitely happen sometime in the future, but not for several years yet.
For the last year I’ve been warning that the bubble phase was coming. It won’t happen overnight. Bubbles start slowly and build steam until the final year when things go parabolic. Just like I was the only one who spotted the baby bull in gold, I’m the only one who is warning that we are in the baby bull stage of the next bubble phase that is likely to last at least 3-5 years. in the stock markets.
I’ve watched as many analysts said I was crazy. Stocks were heading into a bear market they said. Well, here we are only 4 points from new all-time highs. Who’s crazy now. Me who predicted this a year ago, or the same analysts that continue to predict the next crash is just right around the corner?
Folks, it just doesn’t pay to bet on the end of the world. It can only happen once.
Meanwhile, the vast majority of analysts are just like Rick and Mike, trapped in the memory of 2009 and expecting deflation. Unfortunately they’ve been wrong all year and they will continue to be wrong. We aren’t going to get deflation anytime soon. The deflation will only come after the next series of bubbles pop. We are at the very beginning of a massive inflation and my subscribers have been making obscene profits this year because I correctly identified the inflationary trend developing instead of waiting for the sky to fall.
Folks, you have to quit listening to the deflationists, as they are going to cost you dearly in the years ahead. If you agree with what I said in the third paragraph about the power of the printing press, then you need to start buying stuff, almost any stuff, because everything is going up in the years ahead.
As I’ve been saying for over a year, EVERYTHING is going up together. All that printed money has to land on something, and the normal path is for it to land on everything.
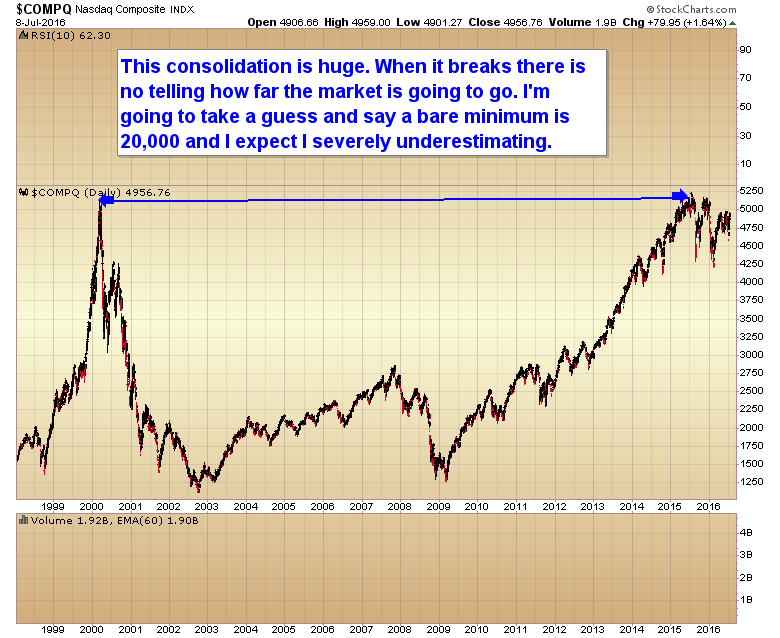
I’ll finish by showing you one chart – the chart of the Nasdaq. The bigger the consolidation the bigger the rally once a breakout occurs. You are looking at a gigantic 15 year consolidation. When this breaks out there is simply no telling how far it will go. There are literally trillions and trillions of inflationary currency units available to drive this higher. I’m going to take a guess and say a bare minimum target over the next 4-5 years is 20,000 and I’m probably underestimating.
Like our new Facebook page to stay current on all things Smart Money Tracker
NEW HIGHS – HERE WE COME
New Highs – Here We Come
Correct again. The S&P has now taken out the June intermediate cycle high and is only 10 points from taking out the all-time highs. You need to use cycles to spot these turns. This is why the technical crowd, EW crowd, etc. continue to get these wrong.
Face it, these guys are never going to spot these turns. You need to understand cycle theory to profit from these major intermediate turning points. You also have to acknowledge and accept that we no longer have free markets and be willing and able to spot when interventions occur.
I suggest that if you are still following someone trying to deny market manipulation you run far and fast in the other direction. They are going to be bad for your portfolio.
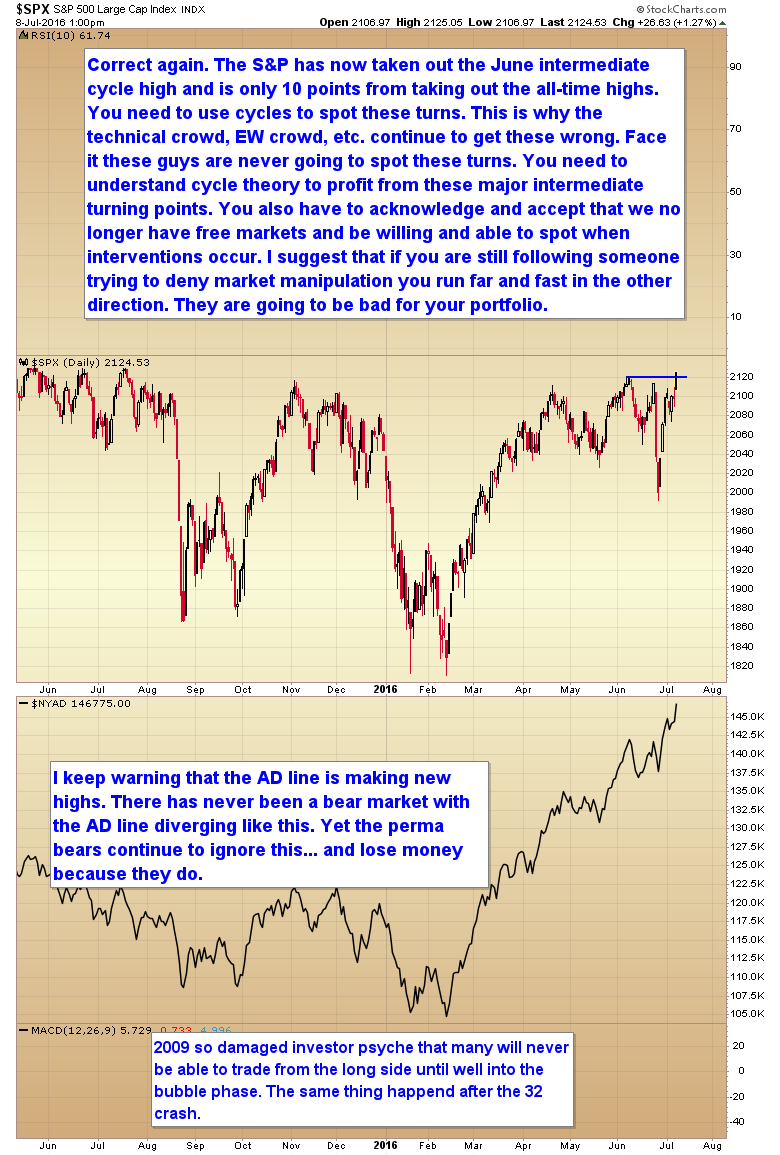
I keep warning that the AD line is making new highs. There has never been a bear market with the AD line diverging like this. Yet the perma bears continue to ignore this… and lose money because they do.
2009 so damaged investor psyche that many will never be able to trade from the long side until well into the bubble phase. The same thing happened after the `32 crash.
Like our new Facebook page to stay current on all things Smart Money Tracker
CHART OF THE DAY – GOLD NEARING RESISTANCE
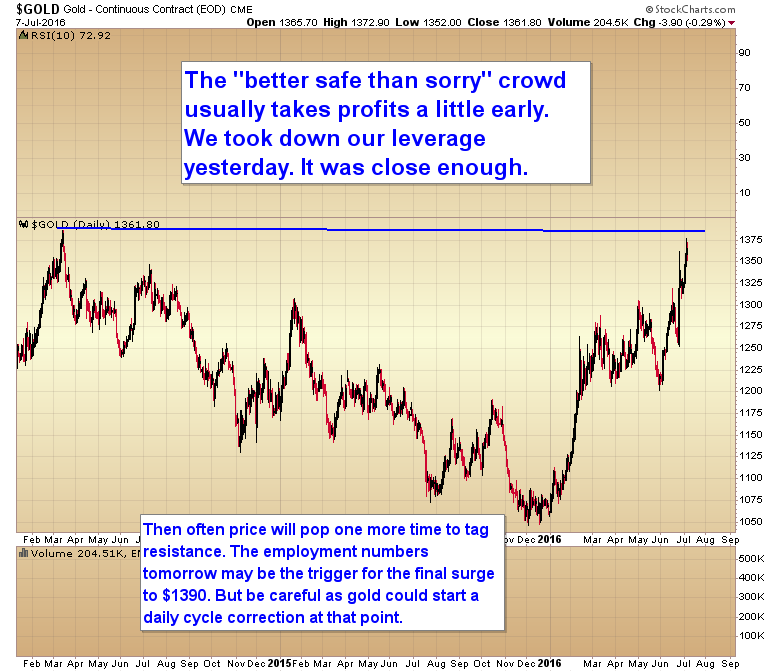
Gold Nearing Resistance
The “better safe than sorry” crowd usually takes profits a little early. We took down our leverage yesterday. It was close enough.
Often price will pop one more time to tag resistance. The employment numbers tomorrow may be the trigger for the final surge to $1390. But be careful as gold could start a daily cycle correction at that point.
Like our new Facebook page to stay current on all things Smart Money Tracker
CHART OF THE DAY – WATCHING DOW 18,000
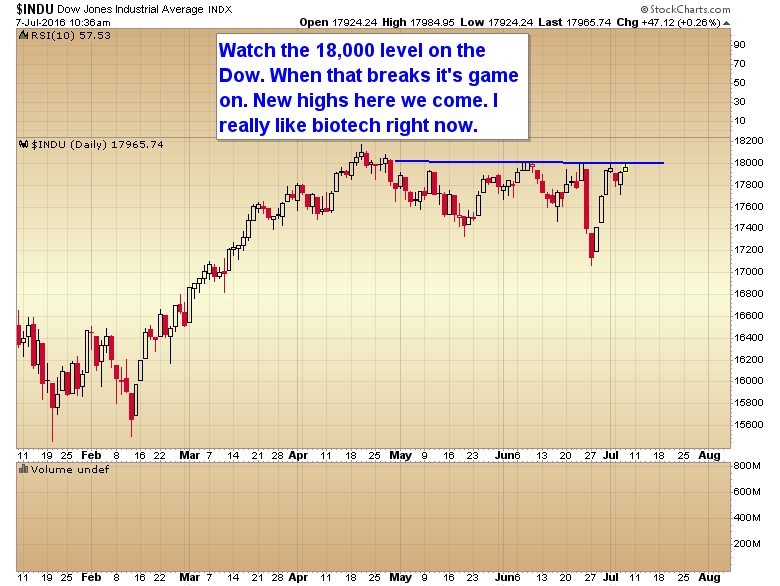
WATCHING DOW 18,000
Keep your eye on the 18,000 level of the Dow Jones Industrial Average. When that breaks it’s game on. New highs here we come. I really like biotech right now.
Like our new Facebook page to stay current on all things Smart Money Tracker
CHART OF THE DAY – FORGET SHORTING THE STOCK MARKET
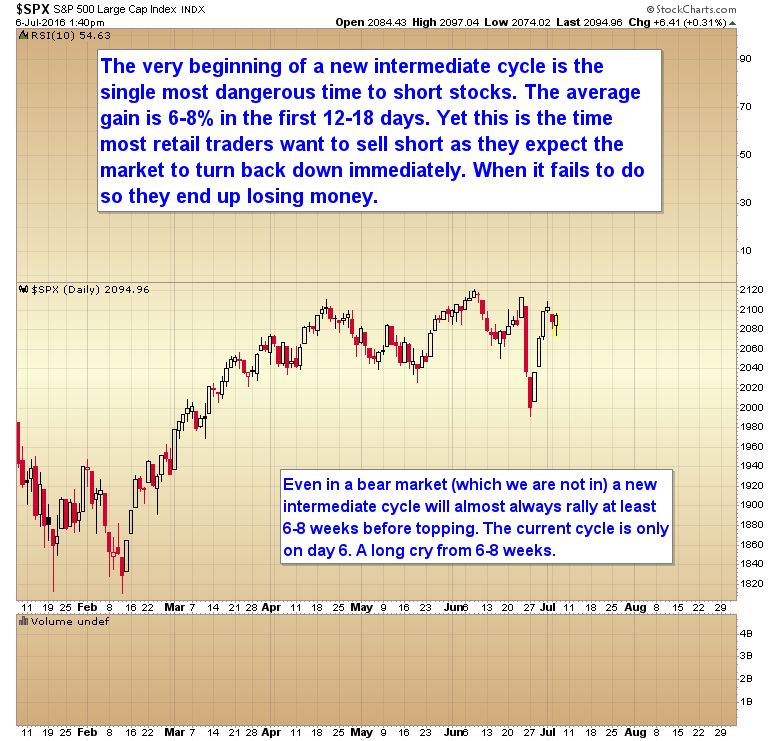
Forget Shorting the Stock Market
The very beginning of a new intermediate cycle is the single most dangerous time to short stocks. The average gain is 6-8% in the first 12-18 days. Yet this is the time most retail traders want to sell short as they expect the market to turn back down immediately. When it fails to do so they end up losing money.
Even in a bear market (which we are not in), a new intermediate cycle will almost always rally at least 6-8 weeks before topping. The current cycle is only on day 6 – a long cry from 6-8 weeks.
Like our new Facebook page to stay current on all things Smart Money Tracker
CHART OF THE DAY – US Dollar
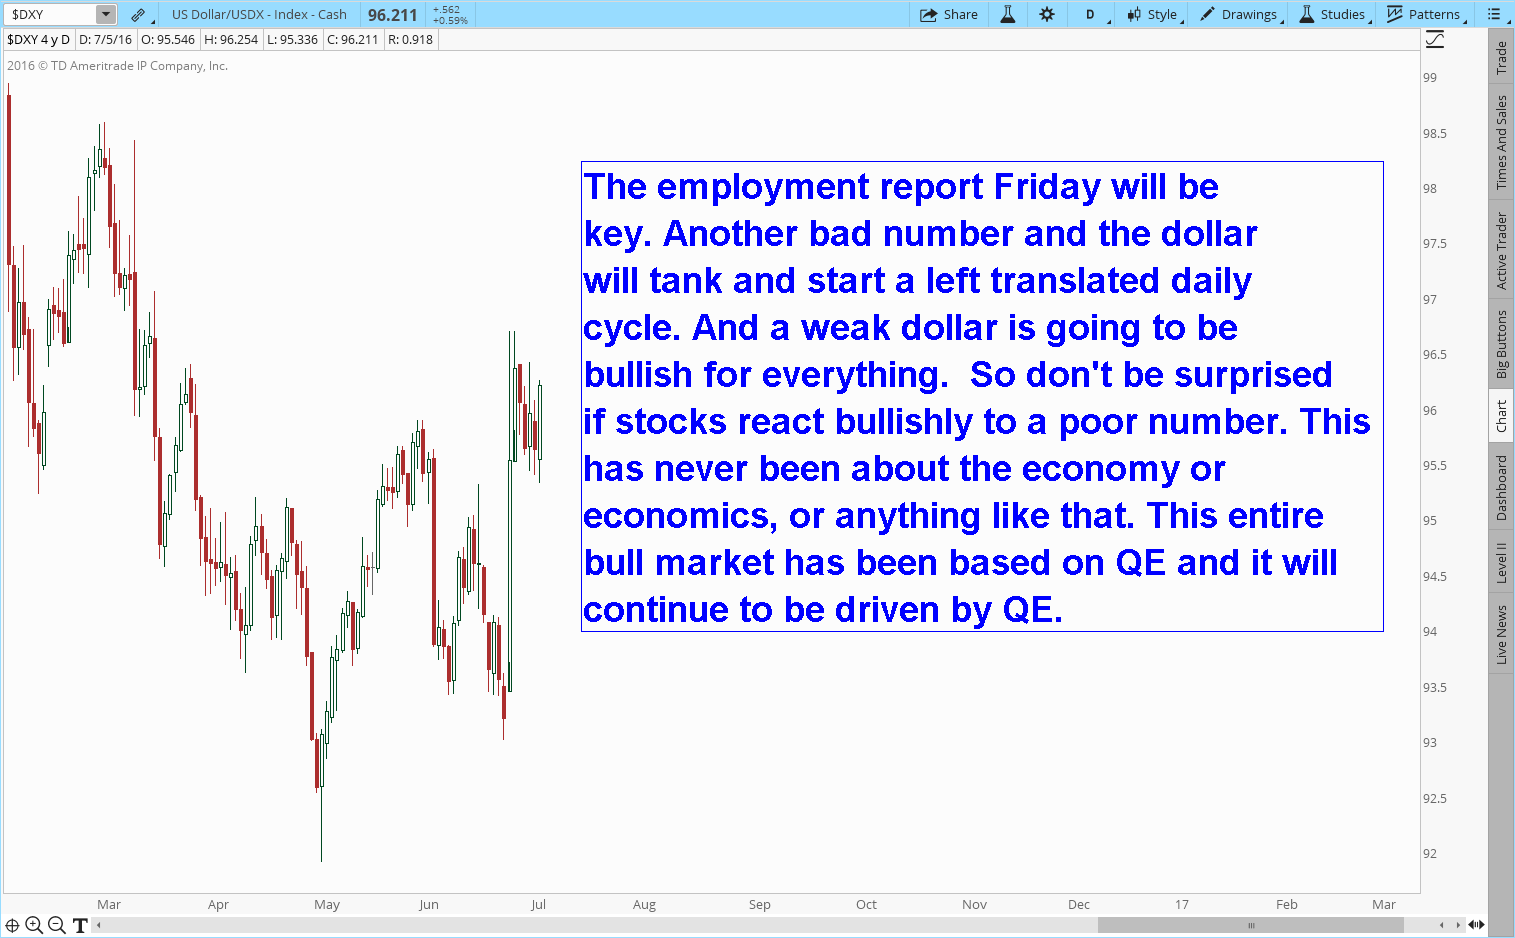
US Dollar
The employment report Friday will be key. Another bad number and the dollar will tank and start a left translated daily cycle. And a weak dollar is going to be bullish for everything. So don’t be surprised if stocks react bullishly to a poor number. This has never been about the economy or economics, or anything like that. This entire bull market has been based on QE and it will continue to be driven by QE.
Like our new Facebook page to stay current on all things Smart Money Tracker
MANIPULATION OF THE GOLD MARKET HAS CREATED RAREST OF OPPORTUNITIES
MANIPULATION GOLD MARKET HAS CREATED RAREST OF OPPORTUNITES
The banksters, by manipulating the price of gold and artificially creating a bear market, have created what will likely turn out to be one of the greatest opportunities ever seen. I’ve maintained all along this was their goal. To create the most destructive bear market in history, which would then generate the largest bull market the world has ever seen.
Folks, you might as well take advantage of this opportunity. The banksters aren’t the only ones that deserve to get rich. They have destroyed millions of peoples lives as the authorities stood by and watched them run the precious metals markets, and especially the mining sector, down to absurd levels over the last few years. Now they have switched sides and the attacks have stopped. It’s time for price to swing in the other direction. And it’s going to swing so far in the other direction, that I have no doubt before it is over this will be the largest bull market the world will ever see.
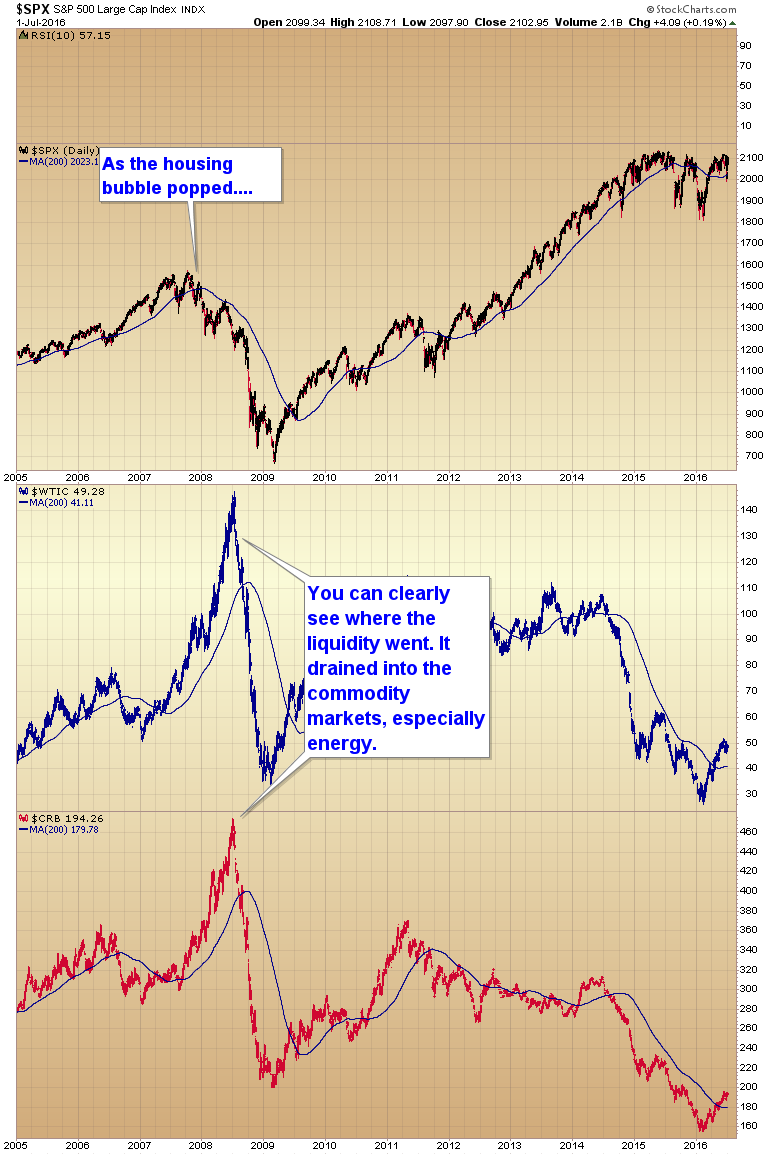
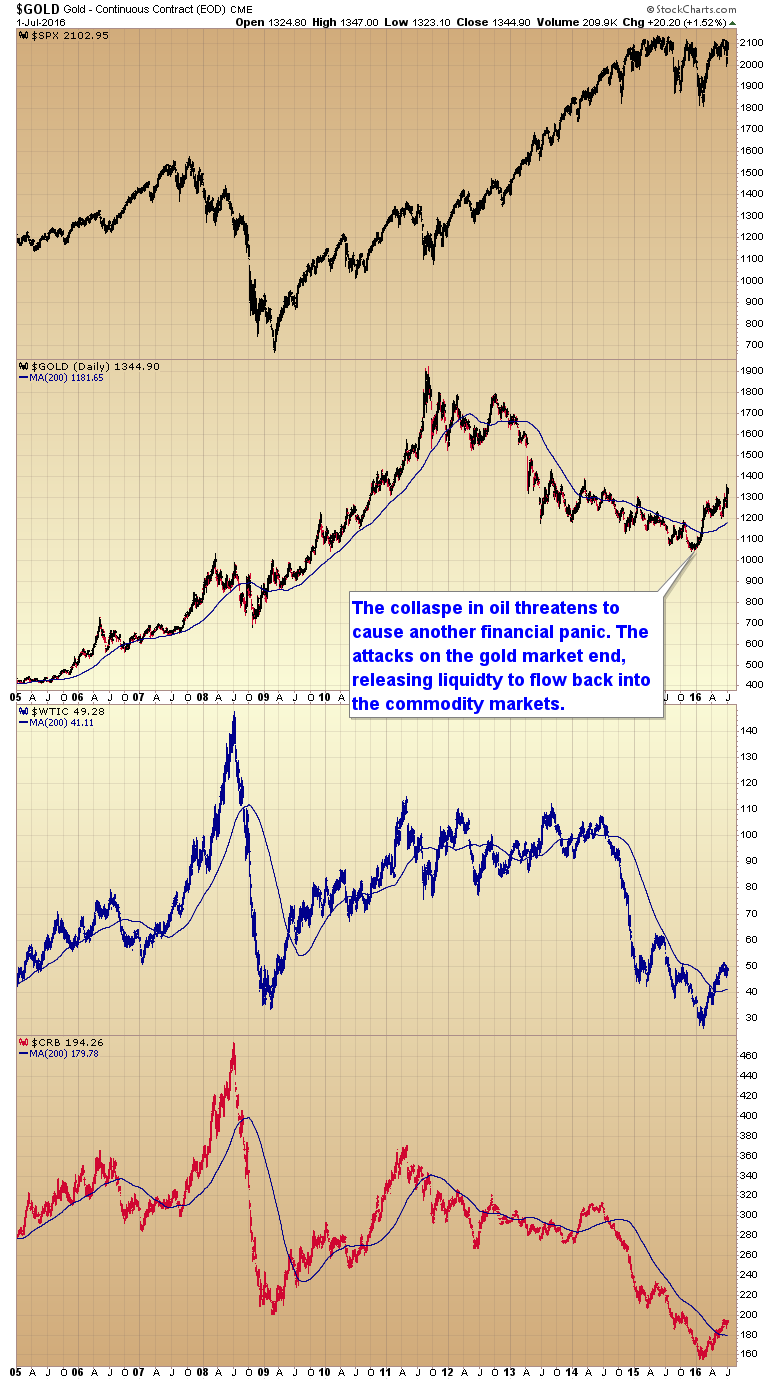
In 2008, as the housing bubble was imploding, the Fed embarked on a reckless campaign of rate cutting and money printing aimed at halting the real estate collapse. It did not stop the bubble from popping. As you can see in the next chart all that liquidity just drained into the commodity markets, especially energy. This had the exact opposite effect the Fed was looking for. The sudden massive surge in inflation broke the back of consumers, triggering a deflationary spiral into a recession.
I’ve tried countless times to educate investors that it is always inflation that occurs first. Inflation is what collapses consumer spending. Inflation damages the economy and leads to deflation, not the other way around.
This is one reason why I knew the stock market is not now entering a bear market. We haven’t had the inflationary shock yet. But we will. There are always consequences to money printing. Without exception it always creates inflation.
So now let’s look at the next piece of the manipulation puzzle.
In 2011 & 2012 the stock market experienced a second crash as QE2 came to an end. At this point it became clear to the Fed that they would have to continue printing in order to keep markets inflated. Without it, the house of cards would come crashing down.
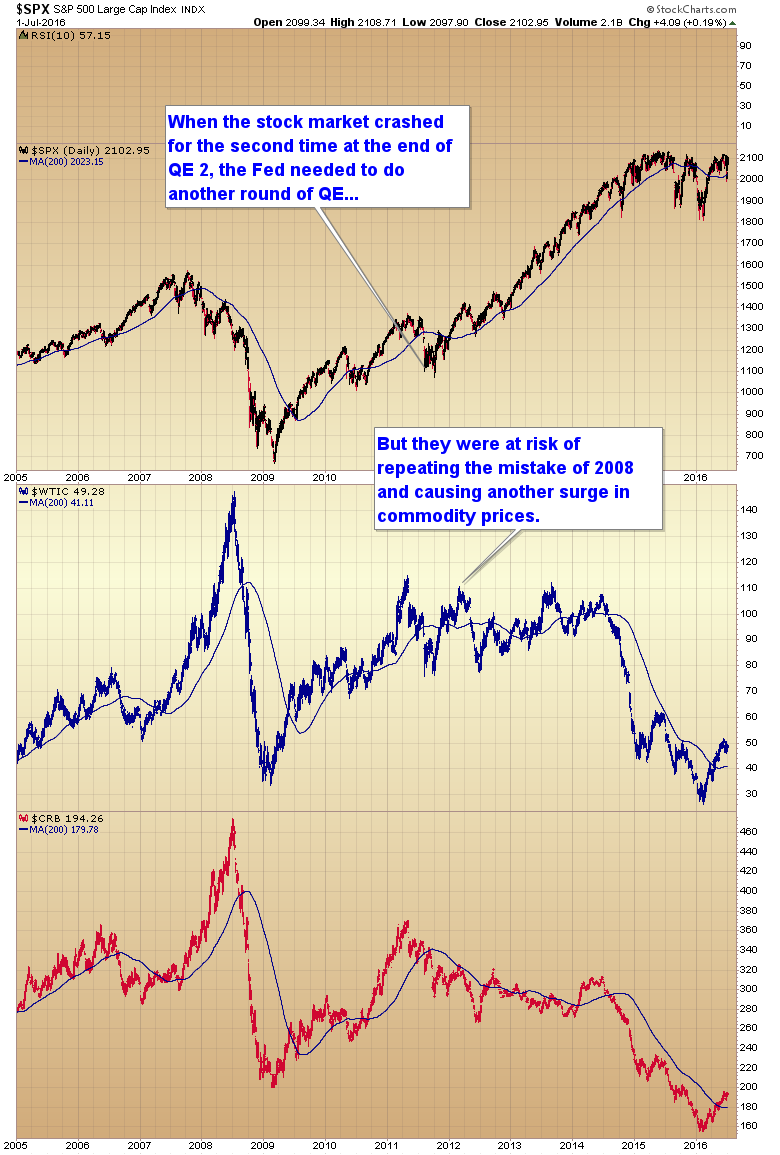
But this time they had a problem. Oil was already over $100. QE3 risked a repeat of 2008 and that risk being that liquidity might flow into the commodity markets, triggering another inflationary shock and collapsing the economy yet again. As a matter of fact you can see in the chart below, right as Operation Twist/LTRO/QE3 began, markets started to surge higher.
So now the Fed had a problem. They were on the verge of repeating the mistake of 2008. They had two choices. Either end QE and let markets collapse naturally to find their true bottom… or find some way to prevent liquidity from flowing into the commodity markets. In essence find a way to direct the inflation solely into the stock market and real estate market.
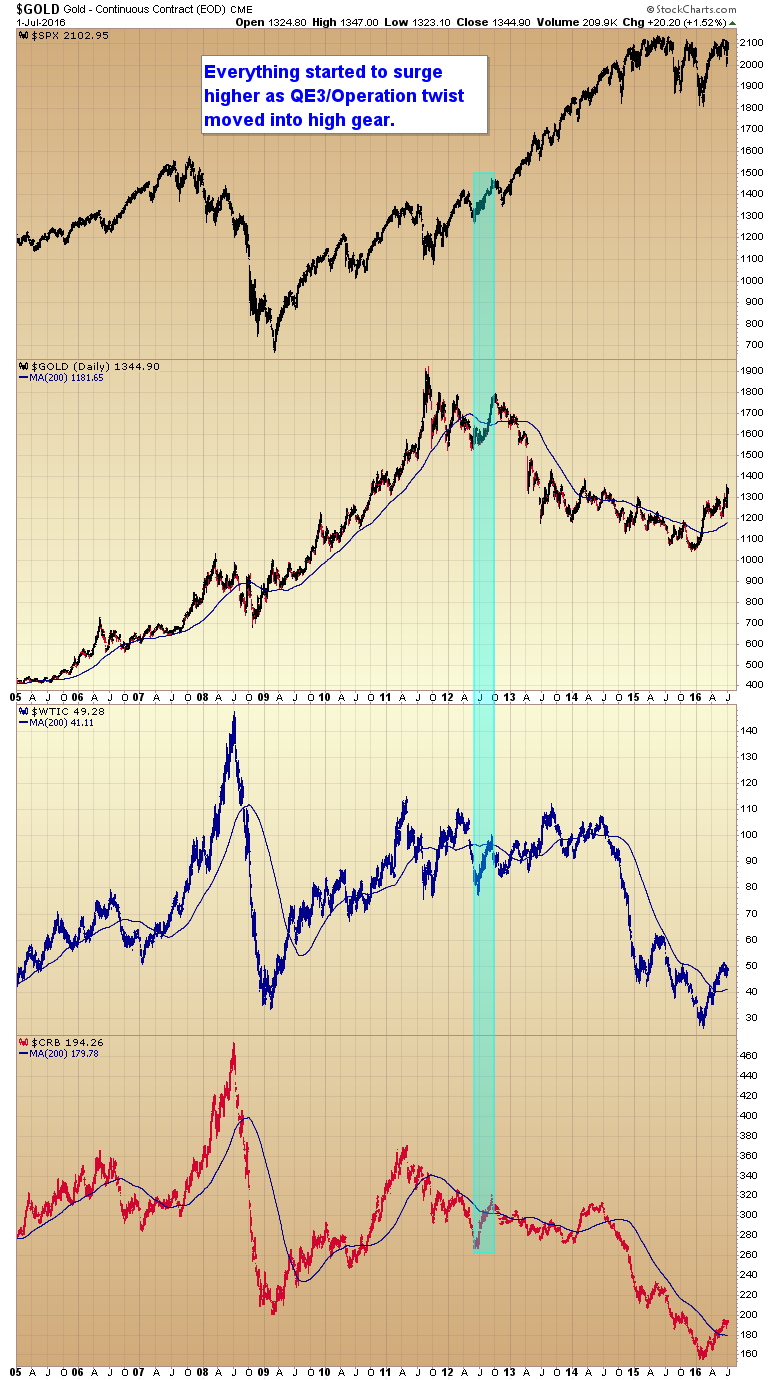
In a natural market this would be impossible as liquidity would tend to flow into all markets equally (this is why I keep saying all markets will rise together). But as I’ve said many times in the past, we haven’t had free markets since the SEC banned short selling in financials in the fall of `08.
So the Fed could try to suppress all commodity markets (impossible) or they could focus the manipulation in the one commodity that tends to lead the entire commodity complex – gold.
You can see in the next chart I’ve marked the point at which the middle of the night attacks began. Notice that the entire commodity complex stagnated at that point. There was simply no way oil, or wheat, or copper, or any of the commodities, was going to go parabolic with gold collapsing.
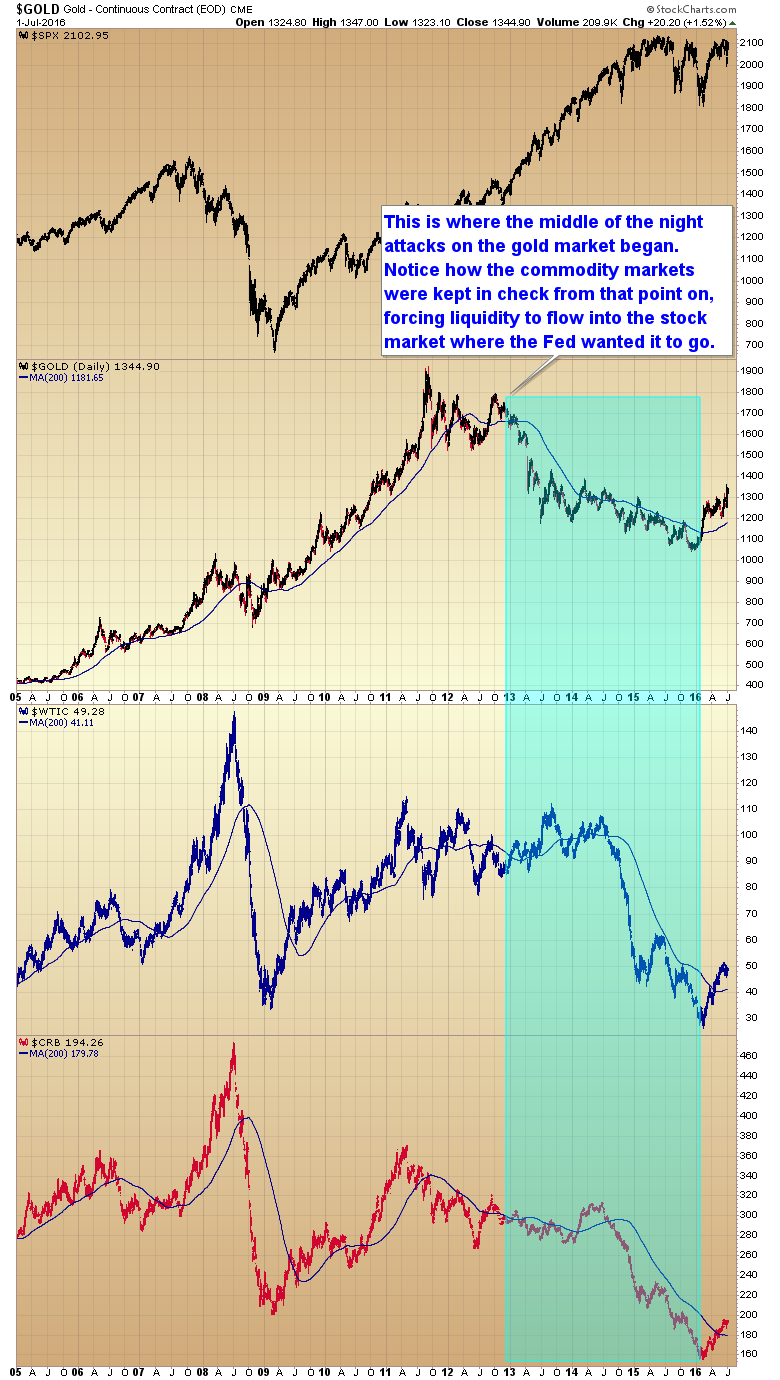
This was right about the time that position limit laws stopped being enforced. The bullion banks were now able to overwhelm virtually any buying pressure by dumping unlimited amounts of shorts on the market, usually in the most illiquid hours, in the middle of the night. So traders would wake up in the morning to having their stops run.
It wasn’t long after this that I realized that a few big banks were going to try to create a bear market. A bear raid. The purpose being to artificially force price as low as possible before switching to the long side. Let me give you an example of what I mean.
Let’s say the next leg of the bull market had begun at $1550 and run to $5000 over the next several years. That is a 220% increase.
But now let’s take that same bull market top, but instead of starting the run at $1550, let’s factor in an artificial bear market that drops price to $1050. A run from $1050 to $5000 is a 370% gain. Almost double the natural market gains that would have been attainable if the market had been left to trade freely.
But now let me blow your mind and show you where the real opportunity was created, because it wasn’t in gold.
The HUI index was at roughly 400 when the attacks began on the metals market. If the bull had begun at that point and assuming a modest 2 to 1 outperformance we could have reasonably expected the HUI to rise to maybe 1600. A 400+% move.
But the bull market isn’t going to start with the HUI at 400. It’s starting with the HUI at 100. The banksters managed to create one of the most destructive bear markets the world has ever seen in the mining indexes.
Now if we just assume that same 1600 top, the potential gains in the mining stocks are now 1500%. And I can assure you the HUI is going a lot higher than 1600 before the gold bull is over. The level of destruction in the mining sector is unparalleled, and it’s going to generate a bull market possibly bigger than anything the world has ever seen before.
And I’m going to suggest that was the banksters goal all along. To create a massive bear market so they could then get long at the very bottom, and ride one of, if not the largest, bull market in history.
The banksters may very well have continued beating on gold if not for one unforeseen problem.
When oil collapsed it threatened to trigger another financial panic. It became imperative that the price of oil go back up. That meant the attacks on the gold market had to stop. And that my friends is exactly what has happened.
Ever since the bottom in December we haven’t seen any of these absurd 10,000 – 20,000 contract dumps in the middle of the night, and not surprisingly, the natural trend in the metals has returned.
At this point the banksters are no longer a gold bugs worst enemy, they are your best friend. This was all done to create a monster bull market. The banksters are certainly positioned to profit from it. Are you?
Like our new Facebook page to stay current on all things Smart Money Tracker