Monthly Archives: November 2014

GOLDEN BOTTOM II

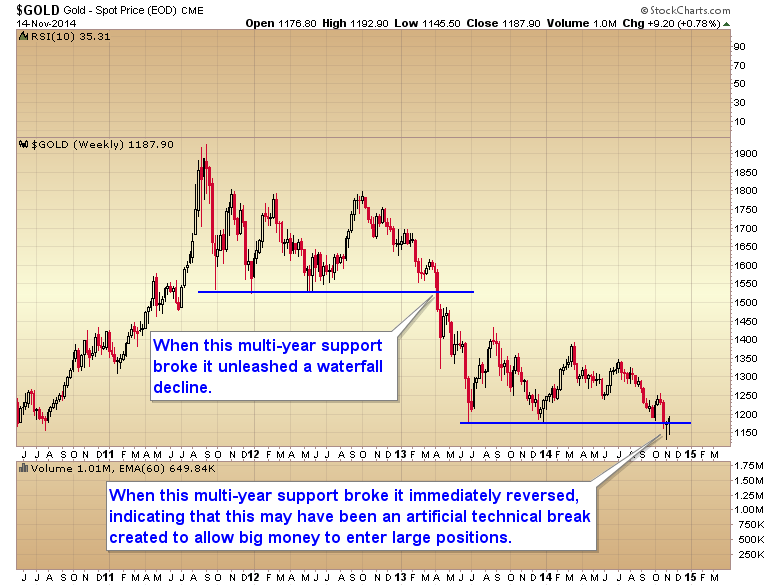
It’s time to do a follow-up to my last Golden Bottom article. We are coming down to the wire and the action on Monday after the Swiss referendum should tell us whether gold has already formed a final bear market low, or whether we have one more drop in this intermediate cycle to the $1050 level before the final bottom.

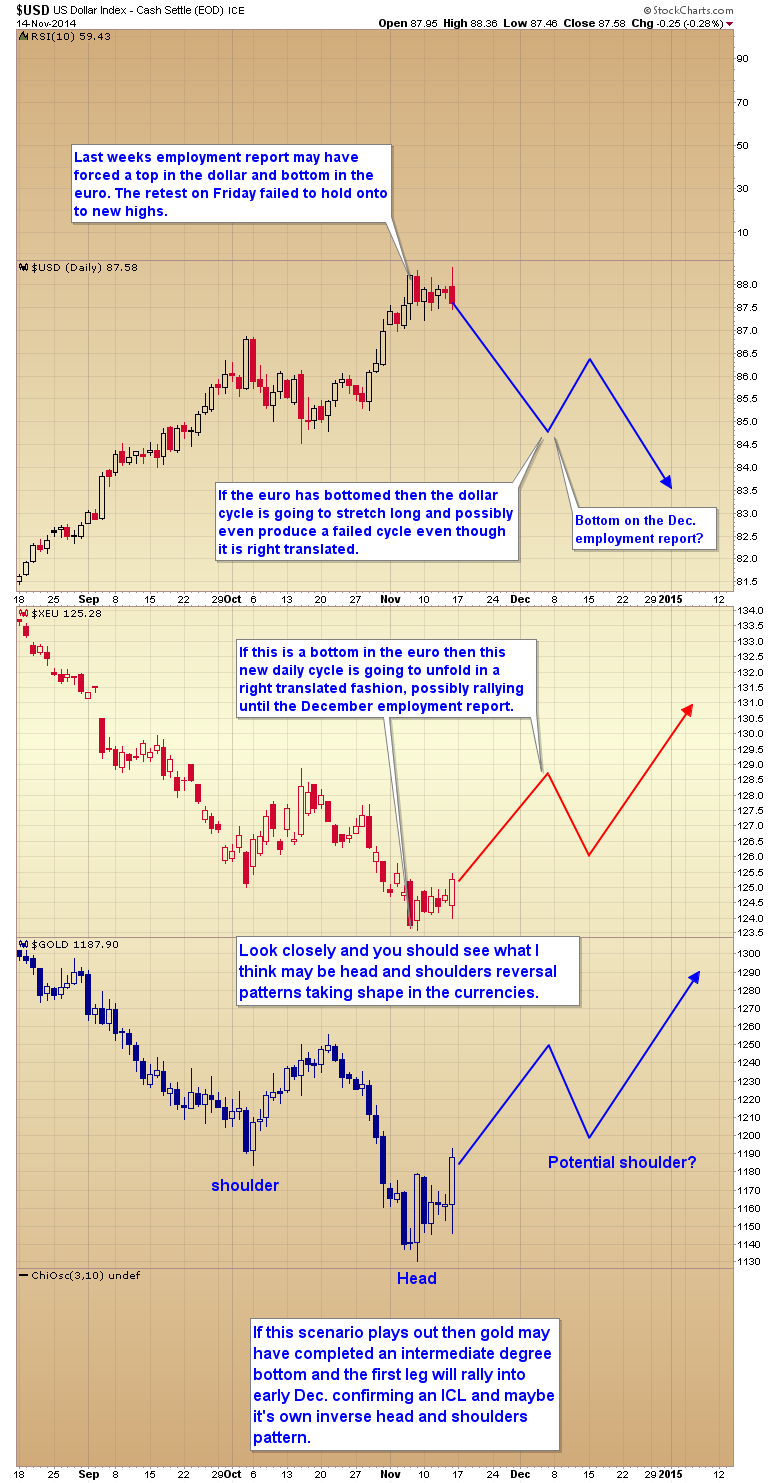
If the vote is a yes then I suspect gold will reverse all of Friday’s losses and immediately head back up confirming that we got the final bear market bottom in early November.

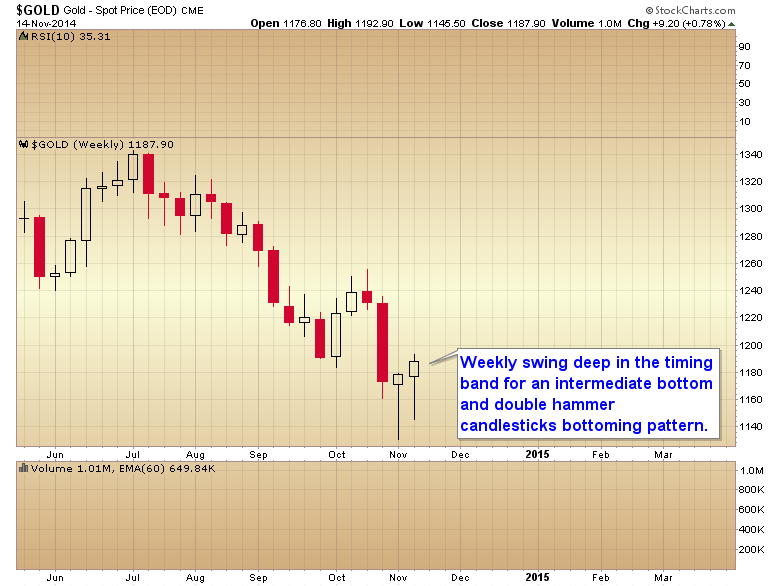
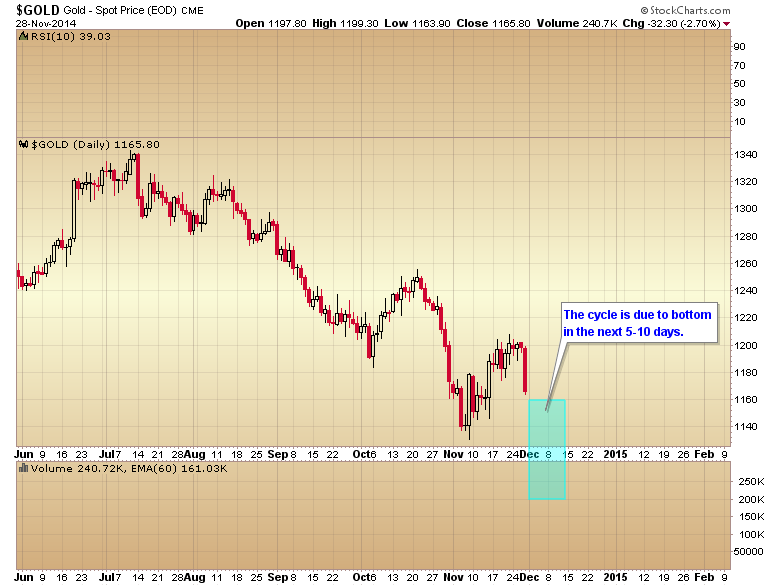
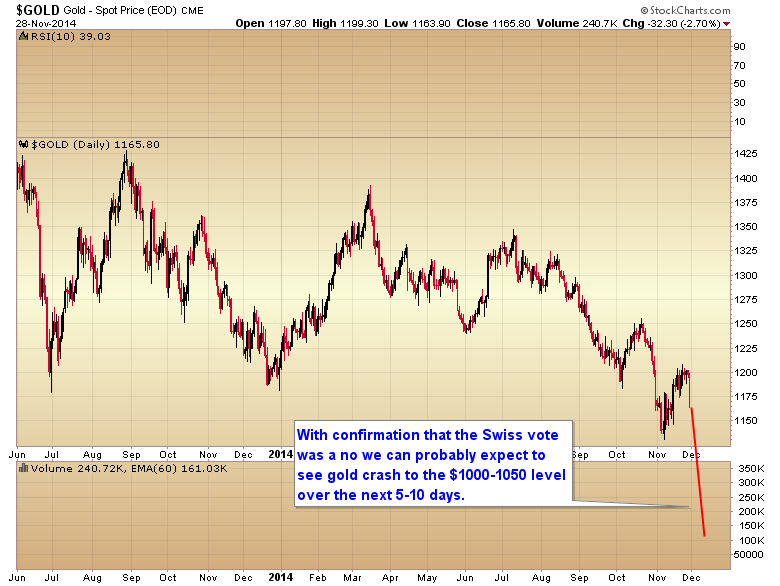
If however, and I think probably the more likely scenario since the consensus is the vote is going to be a no, gold continues down on Monday then the odds are we have one last lower low in the next 5-10 days that will form a final bear market bottom somewhere around the $1000- $1050 level. Gold is already moving into the latter part of its daily cycle timing band. Monday will be day 16. The average timing band for a bottom is 18-28 days. So if the bear market didn’t already bottom in early November, it’s going to bottom in the next 5-10 days.

gold cycle

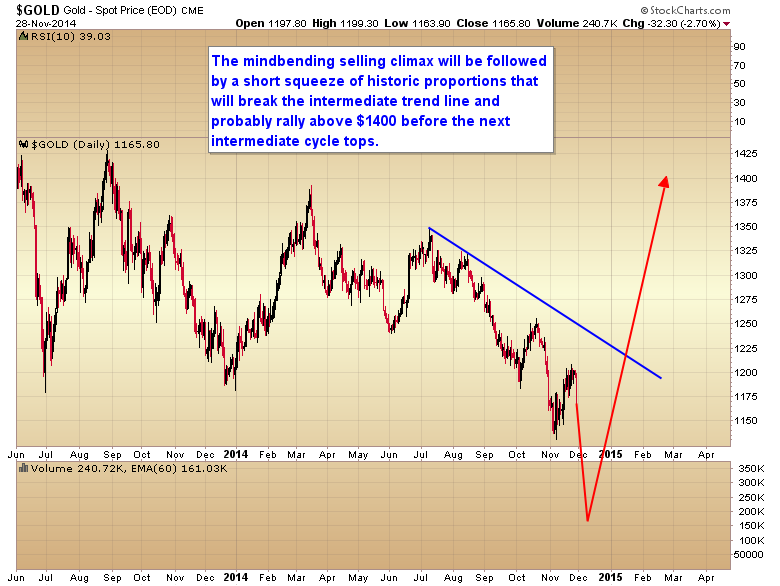
Traders and metal investors need to prepare mentally, because unless the Swiss vote turns gold back up on Monday, then we are going to see a final intermediate, yearly, and major multiyear cycle bottom over the next 1 to 2 weeks. And as I have pointed out in the past the final move into an intermediate cycle low is always quite scary. I call it the bloodbath phase. When the move encompasses an even larger degree yearly, and in this case multiyear cycle the final selling climax is always a truly mindbending event.

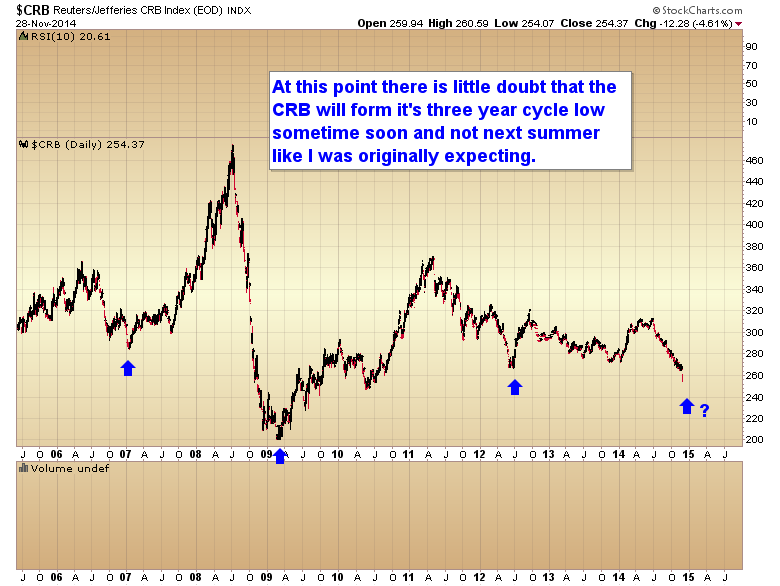
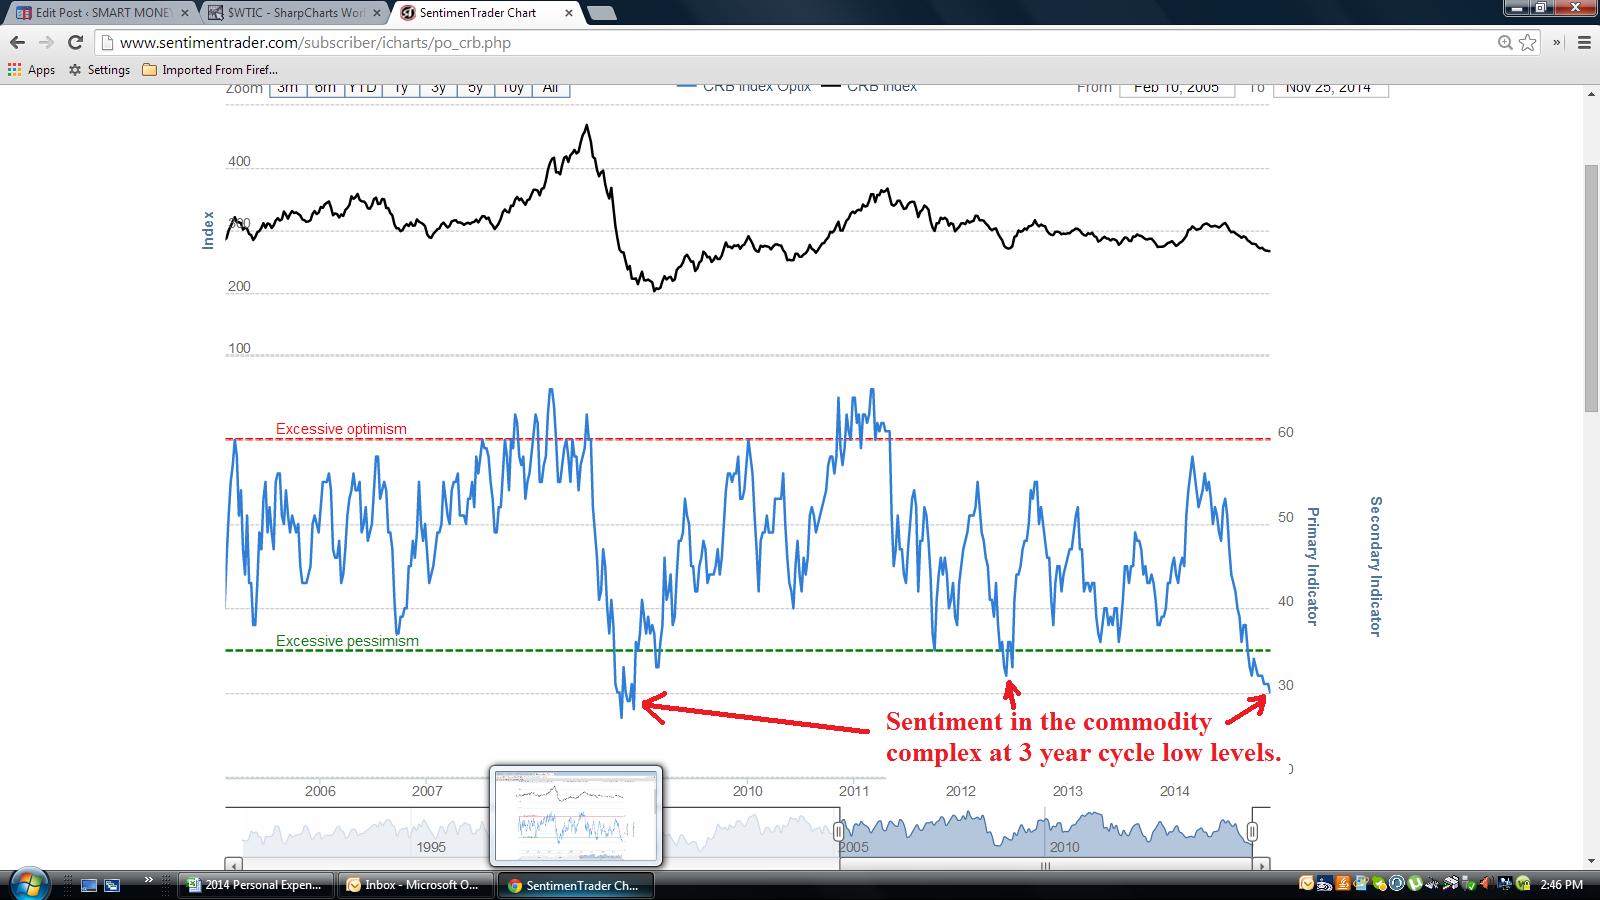
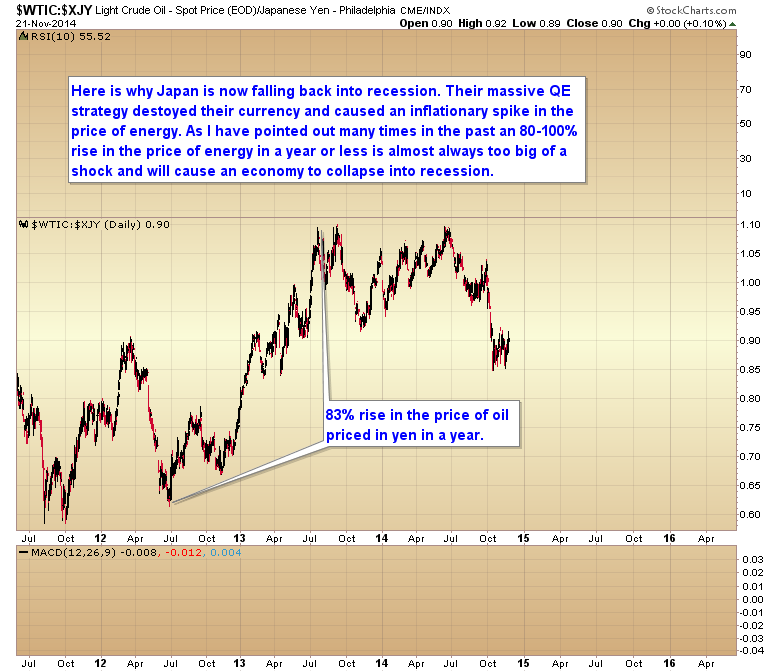
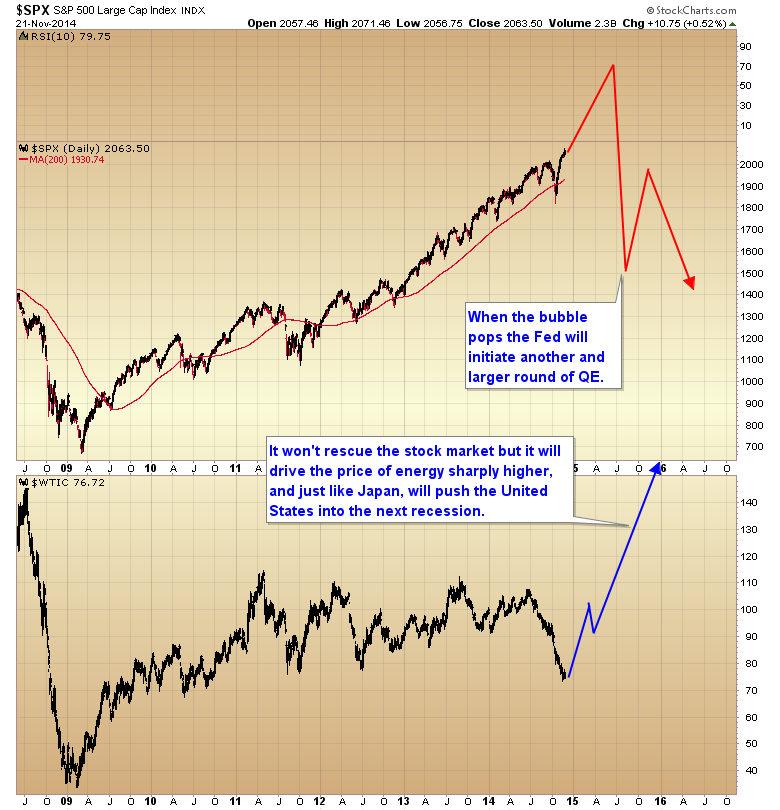
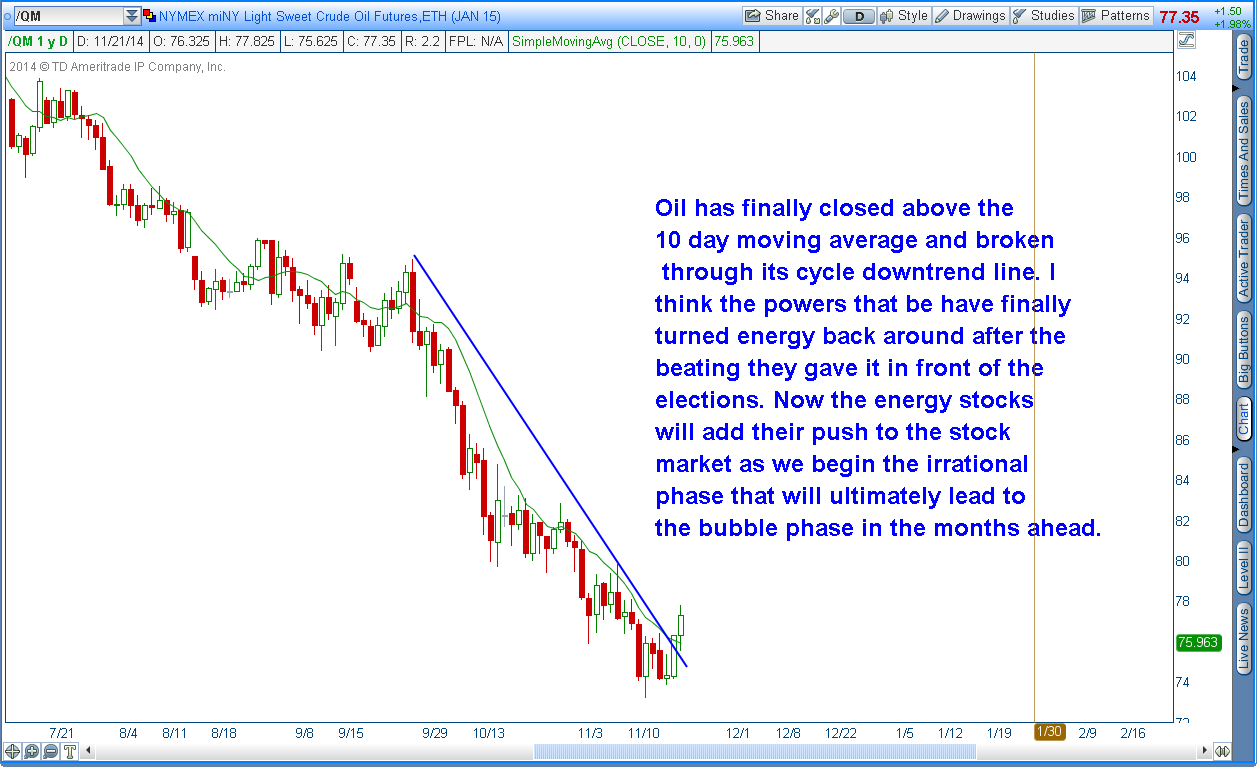
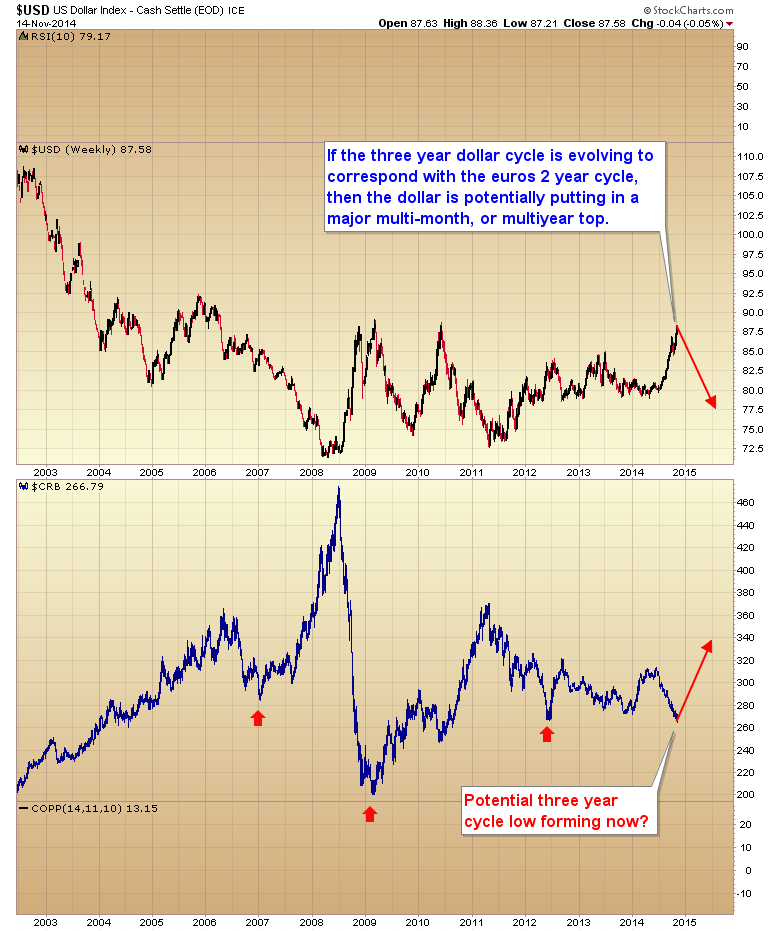
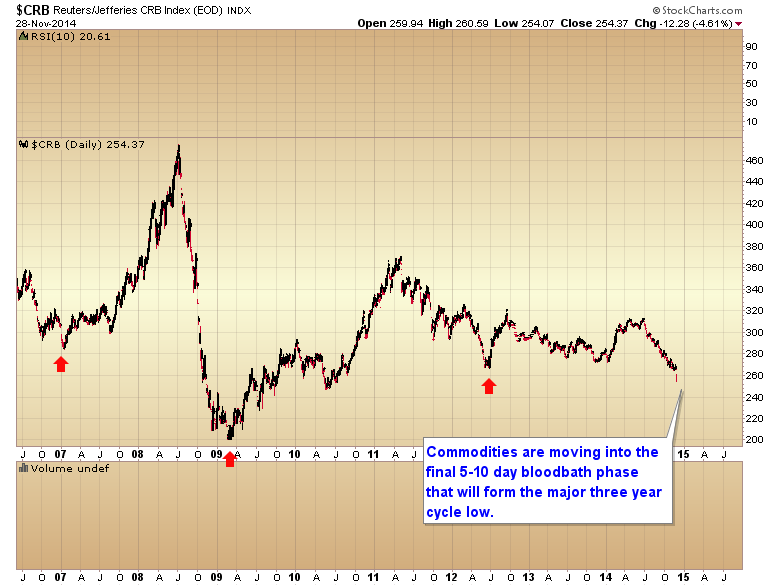
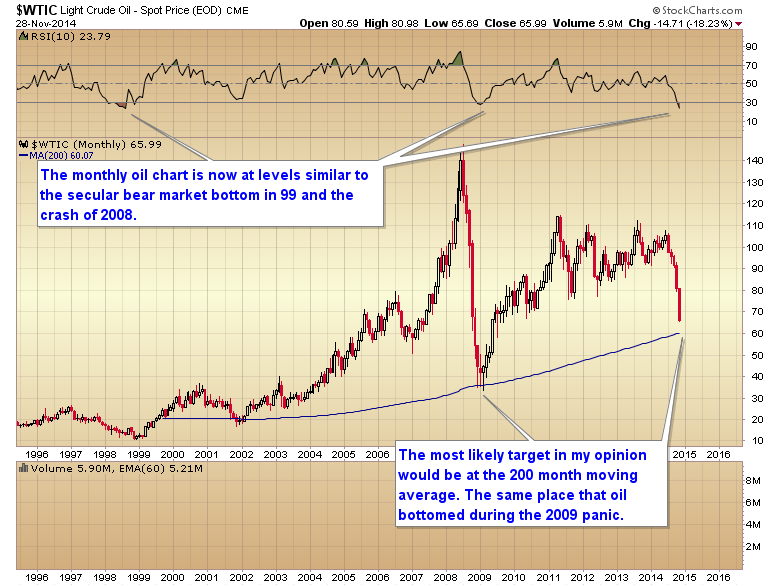
I’m pretty sure the OPEC decision not to cut production has ushered in the bloodbath phase for oil and the rest of the commodity complex as they move into a final three year cycle low.

CRB three year cycle low

Since oil is the driver for the commodity complex the entire sector is likely to remain under pressure until oil finishes its bloodbath phase and exhausts every last bit of selling pressure.

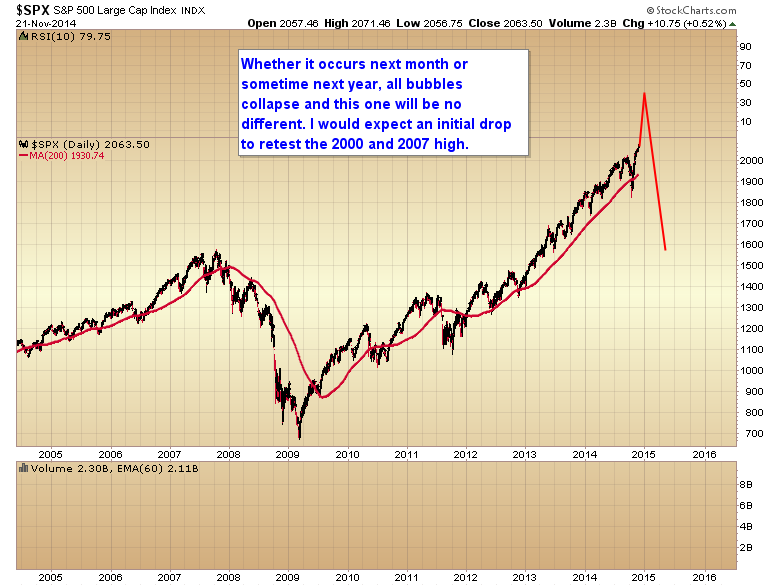
I’ve come up with a couple of potential targets for a bottom. The first and most likely in my opinion, would be a tag of the 200 month moving average similar to what occurred in 2009.

oil 200 month moving average

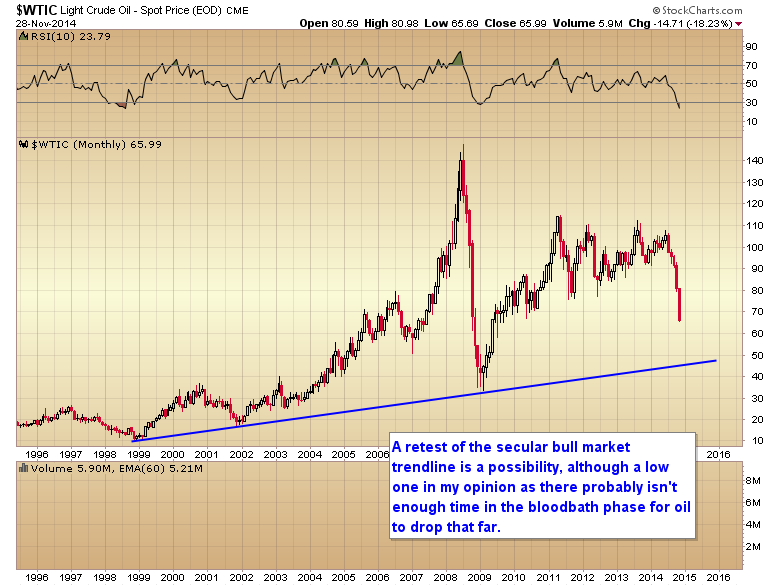
The second, but more unlikely scenario, would be a test of the secular bull market trendline. Since we should only have 5-10 days in this bloodbath phase there probably isn’t enough time for the second scenario to play out.

oil secular bull market trendline

Whichever way this plays out the three year cycle low is just waiting on oil to find its final bottom.

As I am writing this article the news has come out that the Swiss vote was a no, so we can probably expect gold to follow oil down into this final bloodbath phase over the next 1-2 weeks. I’m guessing that means we’re going to be treated to one of those mindbending events, and gold will drop $100-$150 in the next 5-10 days to reach the $1000- $1050 level which will complete a final bear market bottom.

gold $1000 level

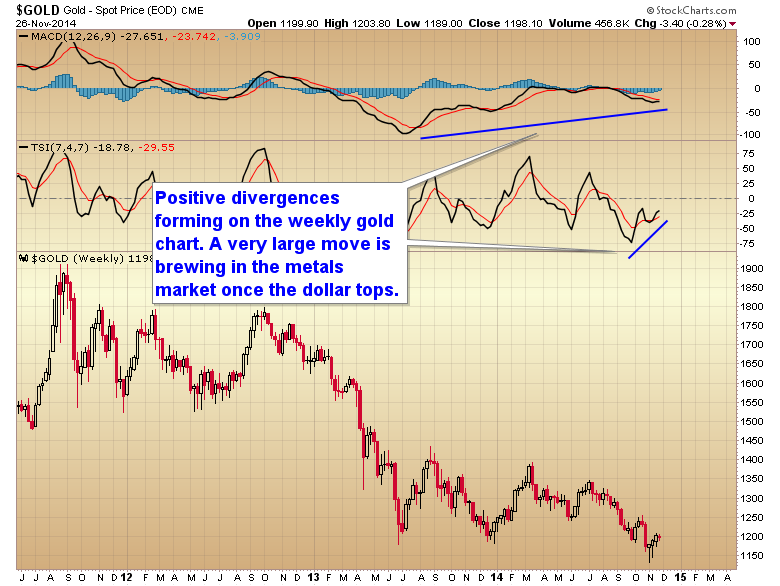
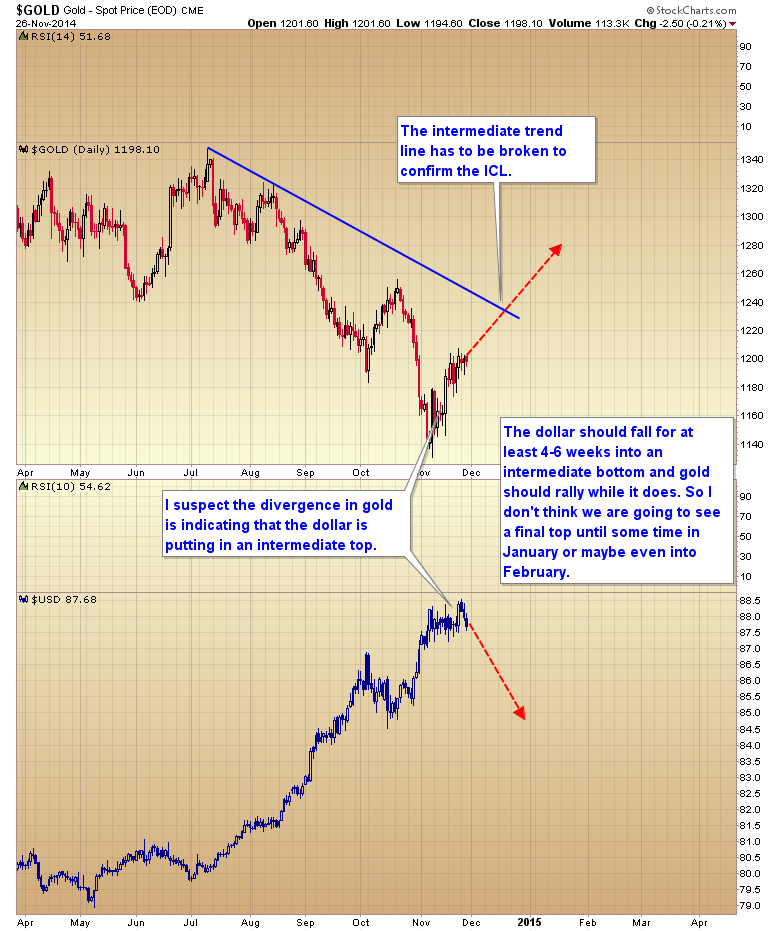
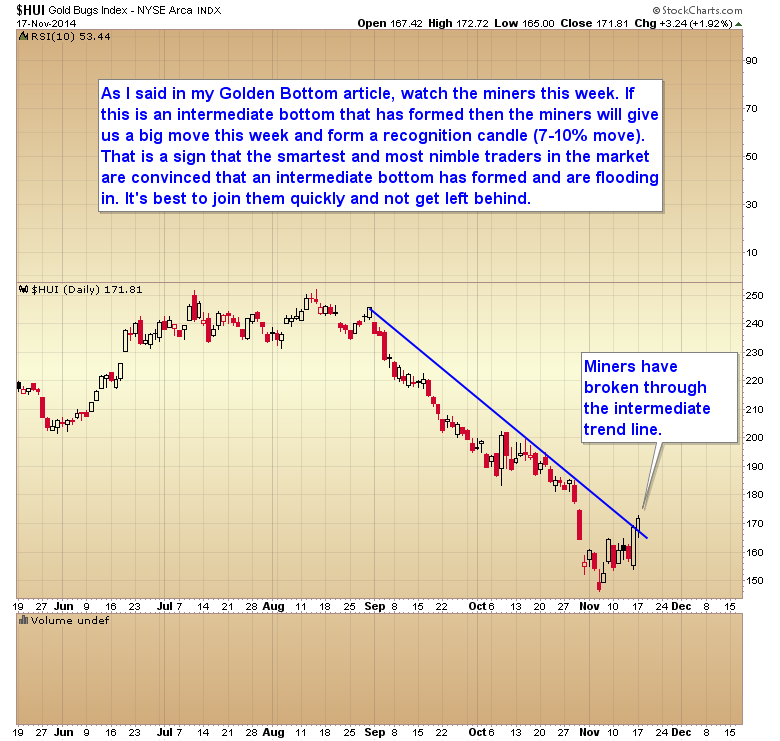
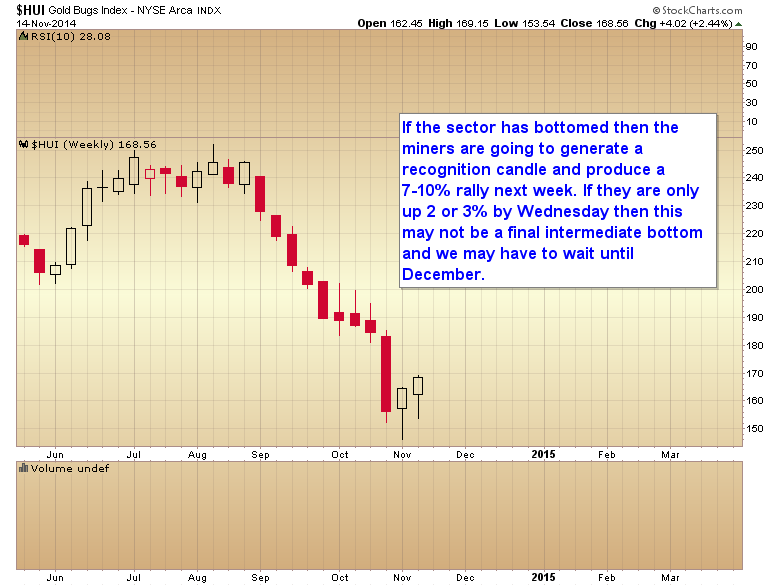
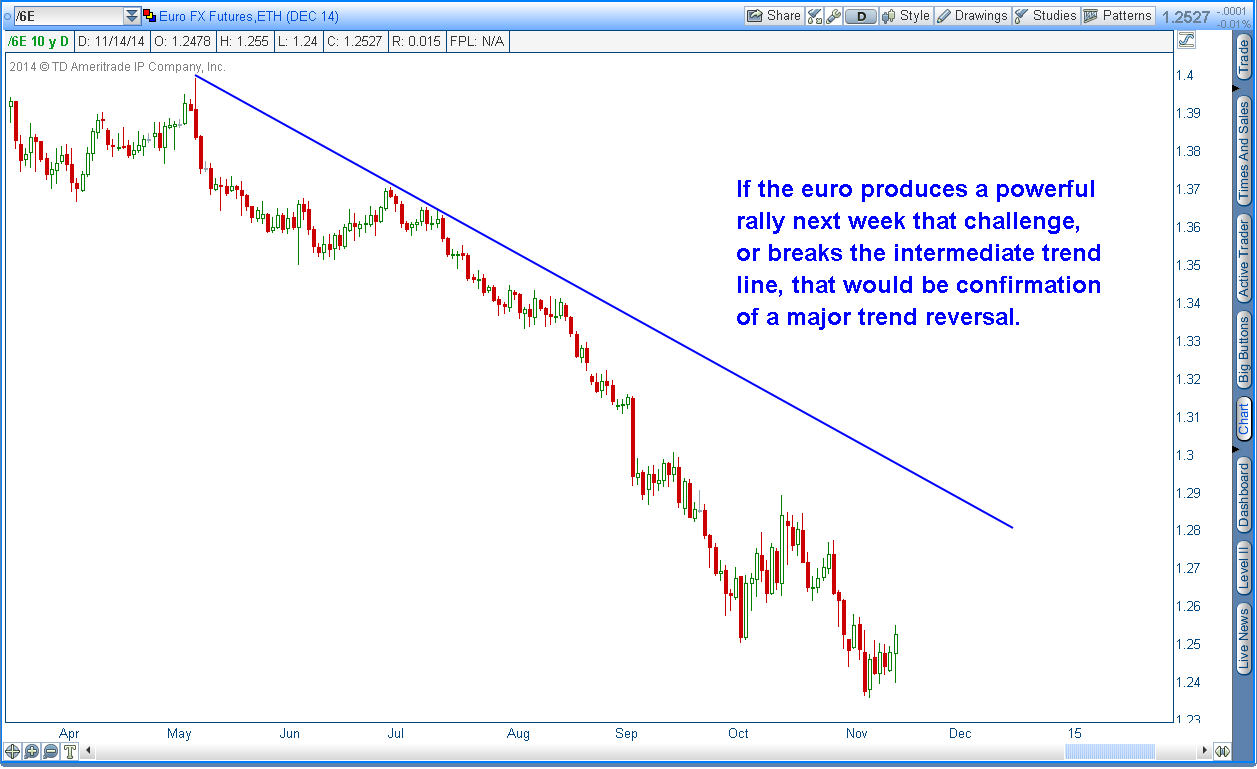
Now here is the good news. A selling climax of this magnitude is going to generate a monster rally off of that final bear market bottom. As I have pointed out in the past, in order to confirm an intermediate bottom an asset has to rally far enough to break its intermediate downtrend line. So even though gold is likely to collapse over the next 1-2 weeks the initial surge off of that bear market bottom is going to be a truly amazing event as smart money floods into the sector generating one of the largest short squeezes in history.

gold intermediate trend line break

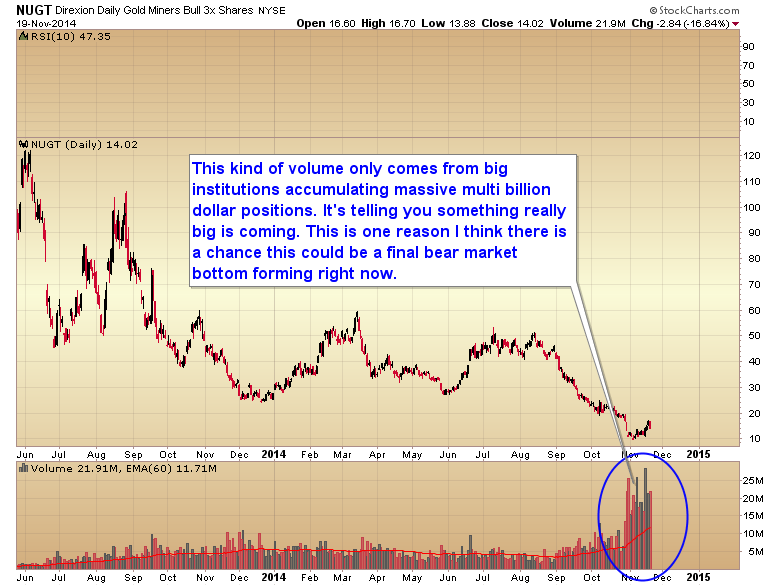
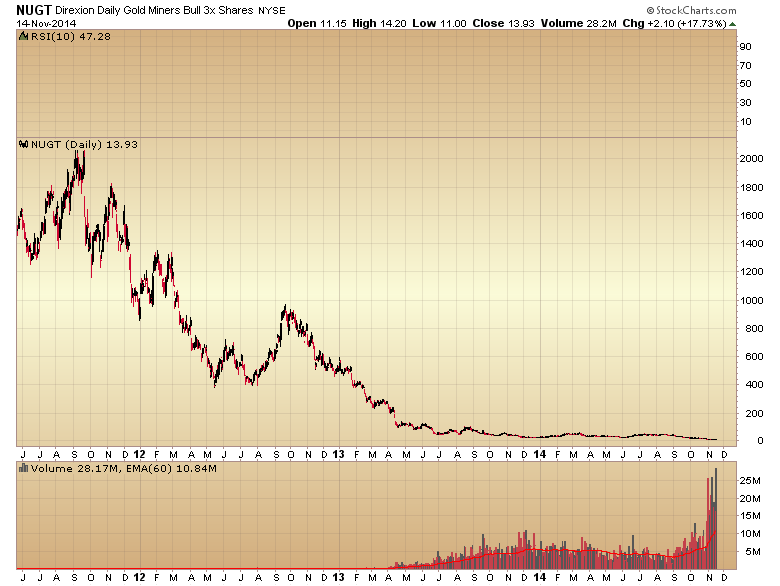
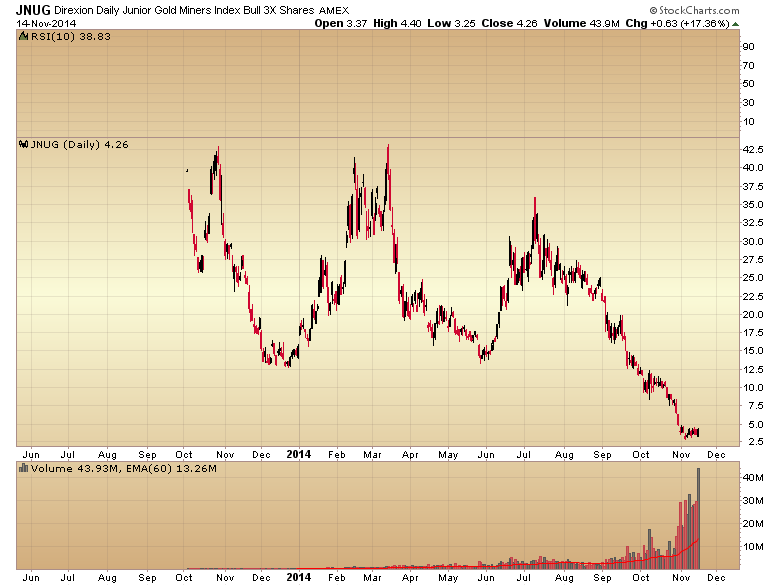
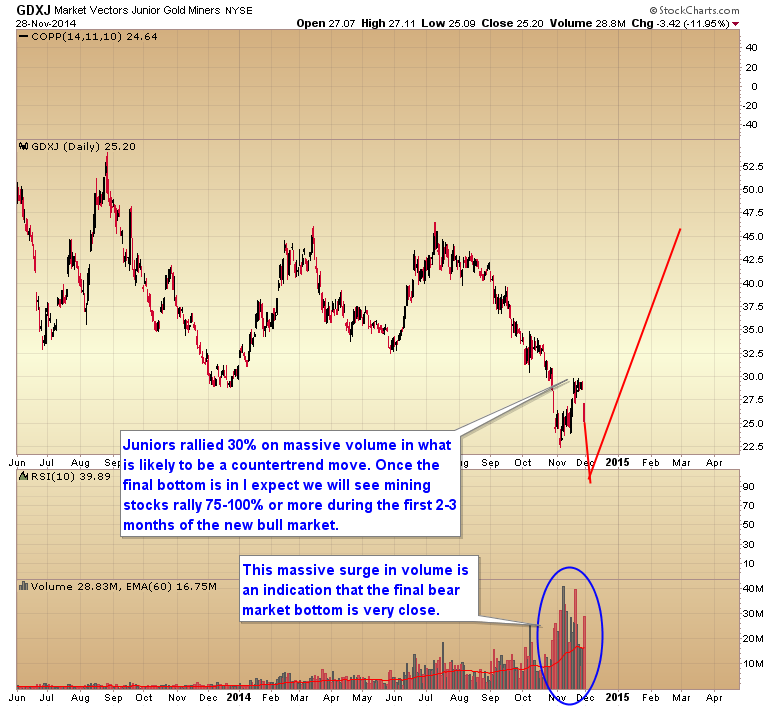
We’ve already gotten a little taste of what is coming over the last three weeks. In what will likely turn out to be a countertrend move, the junior miner’s rallied over 30% on massive volume. Once we get the final bear market low I expect mining stocks will rally 75% to 100% in the first 2-3 months of the new bull market.

GDX J

Traders should get prepared for what is likely to be a very rough 1-2 weeks. Buy some hedges if you already have long positions, and if not, prepare to jump on what will likely be the buying opportunity of the second half of this decade sometime in the next couple of weeks.

Watch the action on Monday into the close. If gold holds the reversal and ends the day positive then there may just be too much buying pressure as big money smells a final bear market bottom and we don’t get another leg down. That would mean that the final low came in early Nov. Wait for the close as it’s going to be volatile today.

SETTING THE STAGE FOR THE NEXT RECESSION

After two years of insane money printing designed to rescue its failing economy, Japan has now been rewarded with… another recession.

So what went wrong you ask? The same thing that always goes wrong when a central bank resorts to money printing to rescue an economy instead of allowing a cleansing period and a return to real productive growth. All they accomplished with their massive QE program was to spike inflation.

As I have pointed out many times in the past, any time the price of energy spikes 80-100% within a short period of time it will almost always cause a recession. As you can see on the chart below when Japan began their foolish money printing campaign it spiked the price of oil 83% as priced in yen. Add to that the increase in sales tax and ultimately this was just too much for the Japanese economy to withstand, and it has now turned back down into another recession.

oil yen

Unfortunately all the pieces are falling into place for the Federal Reserve to follow the precedent of the Bank of Japan and ultimately push the US into the next recession. How is that you ask? The economy seems to be rolling along fairly steadily here in the United States.

It always starts with the bubble. In the short run Keynesian economic policies work, but the end result is that they create bubbles. In 2000 we had a tech bubble. In 2005/06 we had a real estate bubble. In 2008 we had a bubble in oil and a severe inflationary event (which of course led to a recession). And now in 2014 we are beginning the initial stages of the next bubble. Notice in the chart below that the S&P is now stretched 33% above its 200 week moving average.

S&P 200 week moving average

Notice how we have very similar conditions to the 1998 period. In 98 the Fed rescued LTCM and sent the signal to the market that the Greenspan put was in place. The market recovered very quickly from the sharp correction and then entered an orgy of speculation with the knowledge that Greenspan would protect the stock market against any serious declines. That culminated in the NASDAQ bubble.

In October the stock market suffered another sharp correction similar to 1998 and again the Fed sent signals that they would restart QE if needed. This caused the market to slingshot back to new highs, and I believe we are now beginning the initial bubble phase that will culminate with the S&P breaking out of its two-year trend channel, and stretching 15-20% above its 200 day moving average. There is even a possibility this could happen quickly if the NASDAQ were to surge straight up to 5100 in the month of December. Otherwise it may take longer and we get our final top sometime next year. Either way, for a bubble to form the market has to stretch a long ways above the 200 day moving average. That is the confirmation that a bubble has formed. We don’t have that yet, and until we do I don’t think we can have a final bull market top.

bubble phase stretch

So how does this cause a recession you ask?

Let me show you how I think this is going to play out in the months and years ahead. At this point the bubble in the stock market is probably unstoppable. The mistakes have already been made and QE to the tune of multiple trillions of dollars is going to have consequences. The bubble in the stock market will continue to rise and grow, until like all bubbles it pops. This is where the plot thickens. I expect the initial crash will take stocks back down to retest the 2000 and 2007 high. I’ve drawn the chart below with the bubble phase occurring next month, but like I said this could easily stretch out into the middle or even fall of next year before the bubble pops. I’ve noted before that it often takes eight months to a year for a bubble to develop and pop. That’s about how long it takes for the public to catch on and every last buyer to enter the market. If we assume that the bubble began at the October low then we could conceivably see this continue until next fall.

initial bubble pop

Once the bubble pops we all know what the Feds response is going to be. They are going to restart QE and print money at an absolutely mind-boggling rate to try and reflate asset markets. The problem is when a bubble pops, and a parabola collapses, nothing the Fed can do will rescue it. The inflation will come out of stocks and look for something else to land on. Just like it did in 2008 when the stock market topped, the inflation is going to move into the commodity markets, and it will without doubt spike the price of energy at least 100% in a year causing the US economy to follow Japan down into the next recession.

bubble Pop energy Spike

This end game has been unavoidable and unstoppable ever sense the Fed began QE3. When Bullard and Williams went public in mid-October to reassure the markets that more QE would be delivered if needed, it initiated the beginning of the final parabolic bubble phase in the stock market. Now it’s just a question of when will the bubble pop and the terrible consequences of these insane monetary policies begin?

Golden bottom?

Today I’m going to follow up on my last article “Are commodities at a major turning point”.

If commodities and gold are ready to reverse then the first thing that has to happen is the dollar needs to form a top. I think that may have occurred on November 7th when the last employment report was released. Notice how the dollar formed a key reversal on that day, that was retested Friday and failed, forming a bearish engulfing candlestick.

dollar retest

Considering that the daily cycle is now on day 22 and late in the cycle timing band, the odds are good that the reversal Friday marked at least a daily cycle top in the dollar index. If that’s the case then the euro’s daily cycle should have bottomed. Looking at the euro chart it does appear that the euro bottomed on November 7.

euro

Now the question is are we looking at just a minor daily cycle rally to be followed soon by another lower low, or is the intermediate trend about to reverse? If the intermediate trend is about to reverse, then the euro is going form a right translated daily cycle (rally for more than 12 days) which would force the dollar into a stretched decline that may generate a failed daily cycle even though it is currently right translated (topped after day 12). While the odds are against a right translated cycle producing a lower low it does happen rarely, and I’m starting to think it might be setting up to happen in the dollar index. I think we could see the euro rally until the December employment report, which would correspond with the dollar forming a daily cycle low also on December 5 (stretching the current daily cycle to 36 days).

currency cycle expectations

If this unfolds as I have described then both currencies would produce a minor corrective move and then continue the intermediate trend reversal. Notice in the chart below the pattern that would form if this scenario plays out.

head and shoulder patterns corrected

As I have been saying all along, the May bottom in the dollar just did not look like a major three year cycle low to me. On top of that over the last 9 years the euro has developed a very distinct two year cycle, which makes me wonder if the three year cycle in the dollar is evolving into something different. If that’s the case, and the euro is about to put in a major 2 year cycle low, then the dollar is about to form a major multi-month, or possibly multiyear top.

multiyear currency cycles

So how does this relate to commodities you ask? Well as long as the dollar continues to rally commodities are probably going to continue to struggle. But if the euro is putting in a major multi-month, or multi-year bottom, and the dollar a major top, then it’s likely, as I discussed in my previous article, that the CRB is forming a slightly early 3 year cycle low right here and now.

US dollar commodities cycles

So how does this affect the gold market you ask? Well if the dollar is in the process of putting in a major multi-year top (which I think it’s safe to say no one is expecting at this moment) then it is possible that gold just put in a final bear market bottom. Yes I have been expecting gold to make a final bottom next summer, and that is still a very strong possibility, but based on that two year cycle in the euro, there is a credible possibility that the bottom I was expecting next summer is occurring right now.

With Friday’s reversal and rally, gold is now flashing signals that an intermediate bottom may have occurred on November 7. Starting with the weekly charts we not only have a weekly swing (the first confirmation that an intermediate bottom has formed) but also a bottoming pattern with two hammer candlesticks in a row.

gold hammers

Another sign that something may have changed is the false breakdown below multi-year support. The last time this happened in 2013 gold collapsed in a waterfall decline. This time the break of support has been quickly reversed. As I have noted in the past this is often how major trends reverse as big money will create an artificial technical breakdown (to trigger stops and create a massive liquidity event) to produce the conditions necessary for them to enter very large positions. Unlike me and you these institutions can’t just click a mouse and enter positions. They need a panic selling event to bring enough shares into the market so that they can take multi-million or even billion-dollar positions.

technical breakdowns

And speaking of entering large positions, note the volume on the triple leveraged mining indexes. Almost 20 billion dollars worth of shares have changed hands over the last two weeks in just GDX and GDXJ, and that doesn’t even include the triple leveraged funds.

NUGT

jnug

For no other reason than the dollar is due for a move down into its daily cycle low the metals should rally next week. Here’s what I’m going to look for to tell me if the rally is the beginning of a new intermediate cycle and possibly a new cyclical bull market.

First: If gold has put in an intermediate cycle low then the miners are going to produce a very large move this week, somewhere in the neighborhood of 7-10%. A recognition candle stick that signals that the smartest and most nimble players in the market are convinced a bottom has formed and have taken positions.

miners weekly recognition candle

Second: In order for gold to generate a major trend change the currency markets also have to complete a larger degree trend reversal. The rally in the euro will be key. If it rallies enough next week to challenge or break its intermediate trend line that will provide confirmation that the currency markets are reversing.

euro intermediate trend line

So watch these two charts next week and they will tell us whether or not this is just a short-term bounce in gold with one more lower low to follow later in December, or if the metals have completed a major multi-month bottom, or maybe even a final bear market low.

For daily blow-by-blow coverage as this unfolds next week consider a subscription to the SMT premium newsletter.