Strictly Necessary Cookie should be enabled at all times so that we can save your preferences for cookie settings.
If you disable this cookie, we will not be able to save your preferences. This means that every time you visit this website you will need to enable or disable cookies again.
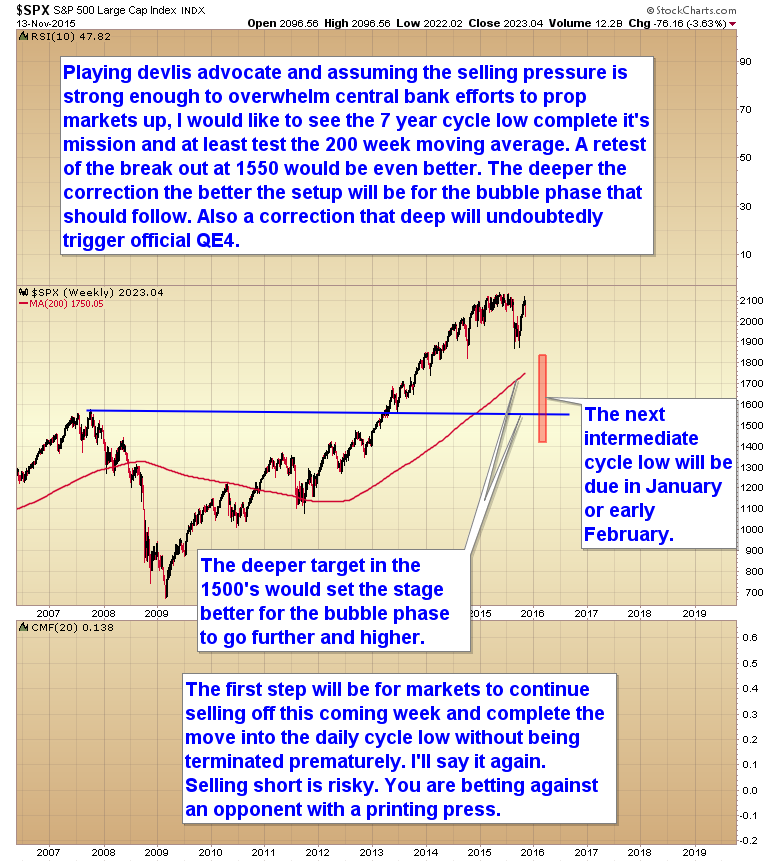
1550? January? Do you realize you’re calling for a 25% drop in two months? That’s catastrophic– what’s the catalyst? Are they gonna say “PPT doesn’t rescue the markets this time?”
The 200 week moving average would be more realistic, but another crash scenario isn’t off the table. The SPX fell almost 20% in a two week period in 2011.
The catalyst may be starting right now in France.
25% is not catastrophic; it happened in one day in Oct 1987. And then it was off to the races.
News Alert: NOTHING is “catastrophic” anymore in the world we live in. Ask ISIS.
Many mainstream financial analyst are looking at the mid-2011 analog or a replay now. That would imply that the August lows be violated to the downside, reversing and the resuming the cyclical bull market trend in 2016. Many sell side analysts think China’s “Hard Landing” scenario is off the table and that whatever stimulus (liquidity) removed by the FED the Bank of Japan and European Central Banks will offset with new (liquidity) injections, thus propping up assets prices. That is the current narrative, that is how they are positioned(ing). Very few are betting on a bear market in equities, the U.S. Dollar topping/rolling over and gold resuming its secular bull market. Many cannot envision a scenario where gold reasserts itself as the foundation of the global monetary system. Keynesian and Monetarists who are in control will fight deflationary forces, thanks largely to their policies of keeping zombies alive, by intervening in the business cycle and stopping the natural forces of creative destruction. Bubble watchers cannot see a bond (debt) bubble right before their eyes.
From 2002 to 2015 commodities are the worst performing asset class with the highest amount of volatility, we are witnessing a sea change moment in 2015 since the S&P 500 has crossed its 50 DMA over 35X’s the largest volatility since 1930. Imagine that hard assets (commodities) become the “safe haven” asset class with the least amount of volatility over the next 10-20 years where stocks/bonds replace them as the worst performing groups in the marketplace.
P.S. Very few traditional asset allocation models being sold by the sell-side on Wall St. have more than (5%) gold in the aggressive allocation models and (0%) in the conservative and ditto for a commodity basket. Nobody and I mean nobody recommends that clients have physical gold, silver or fiat currency held outside the banking system as part of a diversified portfolio and wealth management plan.
It’s now a new paradigm for investing ever since the panic of 2008. Mainstream conglomerate institutions overwhelm the majority with pensions and 401ks and control and dictate the money flows that have been and will continue to be diversersed in the US stock market aka legalized ponzi scheme. Commodities yes but at a partial percentage at best. I also think as George Gilder advocates that not only the internet dominates technological advamces that intrigues the money flows but since has been trumped therafter with wireless applications and now the digital era!
100% into commodities? Nah not happen IMO.
PPT and QE will save us all so I think from a chartist perspective 1994 will hold
1500’s? No way Jose.
Gold has taken a back seat and will for quite some time. Bankers have the right pathway of rationality.
Crude fundamentally is screwed taken it back to investing 101 of supply and demand. Speculators can only do so much.
Ride the trends my friends long and short.
And don’t forget the IMF will vote on China in late November and if they are indoctrinated we are talkin’ at least a trillion dollar injection into their markets which will have bullish implications worldwide.
I agree they likely keep SPX propped up if it gets to the 1990s, and then maybe in the winter we will see a correction to around 1800. I think the world would practically have to end for then to let it drop to 1550.
http://www.barchart.com/headlines/story/12153870/short-term-market-drop-likely-following-paris-terror
Market down
Crude down
Gold up?
Market’s hate uncertainty:http://abcnews.go.com/International/french-jets-bomb-syria-police-launched-international-manhunt/story?id=35215091
Contrarian Indicator (bullish for gold):
http://www.bloomberg.com/news/articles/2015-11-15/investors-flee-precious-metals-as-etf-outflows-top-1-billion
Gary, could be.
But in the short term, I’m waiting for a bounce on the SPY – maybe tradable – the price action looks like bottom, and the VIX confirms. Who knows.
Where’s Muffin? This ain’t no blog w/out Muffin. Muuuuuuuuuf?
Haha Thx for that Bill 🙂 Click on the link below if you’re wondering what I’ve been up to all week.
Ps: It’s not finance related for all you ‘die hards’ out there! Jeez.
https://www.youtube.com/watch?v=N-CSBFdDZsw&list=LLo3L4rv8P-UJB6ThANZ8k2Q&index=1
Super cute!
Holy Moses!
http://www.kitco.com/charts/livegold.html
Paris bombing, that gold gonna rally and stocks gonna crash. Hmmmm…. Last time I check, index just tested a key break out point and bounced. Whether it holds, I dunno. But what I know is this. Gold could only rally 0.3% on this bombing news???!!!! Lol. If something suppose to go up can’t go up, its going down. So gold is gonna drop below $1000. And that makes the stock crash scenario even less likely.
The party’s just begun my friwnd.
Wrong. Gold and stocks cn go up or down in tandem. We have seen it happen. Deflation takes all down. Gold is reverse stocks up to a point only. Does not have solid, concrete inverse relationship with stocks.
Paris bombing may be a one day wonder in gold and after that it fizzles out.
David, the inclusion of RMB into SDR basket is pretty much a done deal. The $1 trillion flow (estimated by GS) into China in the next 5 years will see the bulk of them going into Chinese bond market. And, Chinese equities would surely jump with the flow…that’s the reason why SHSZ300’s weekly resistance was broken up decisively in the past weeks!
cheers!
Both XAU & XAG have a bullish engulfing candle-stick on its daily charts…but this needs to hold until the end of the day in order to warrant a follow through tomorrow…
Otherwise, momentum will be bad…
Oh William it will hold, this is a perfect storm that eas brewing before the black swan landed therefore the shorts are toast! Enjoy the show.
same page here…just don’t wanna sound it out…let the action dictates itself mate!
New Crest is up +6% now and this baby doesn’t normally do up this much and crash…no way, so it should hold there!
Yum yum.
Most importantly, there is a “hell big” bullish engulifng candle-stick on both of its daily and weekly charts…i mean New Crest Mining! (my proxy for gold-miners from the down under…)
The NASDAQ and SPX appears to be forming an inverted HS. Only a daily close below October lows will signal a crash scenario. So let’s see
The bullish thing for gold to do on Paris bombing is at least gap up $10, then stays up and rally. Not this up a little, can’t even stay up $10 scenario. So, even if it rallies $50 over next 2 weeks, looks more like a dead cat bounce
OK, but ther eis only ONE problem: Gold ain’t interested.
Gold just flash the buy signal in the 1 hour chart & very close to do the same in 4 hour chart. Waiting at least for that one for Jumping.
Usd is unable shorterm to break 100. So i think the road the most easy is Down for Usd & Up for Gold this week.
We see the rally maghitude before have further price objective.
Good luck everybody
Gary, in a previous post you said this:
“I pointed out the divergence in gold indicating that a DCL was near. It looks like it was struck today. We should get a pretty convincing rally for 6-10 days. But because gold didn’t make a lower low and confirm a yearly cycle low I’m afraid we may have one more lower low in Dec. before the final ICL/YCL prints.”
The thing is that gold did make a lower low on the charts I use. Did you mean a new closing low. Don’t understand why the ICL/YCL would be off the table.
The futures didn’t make a lower low. Are you looking at GLD? GLD doesn’t trade round the clock so it won’t show overnight action.
If gokd can clear and close 1095.80 then we’re golden for a swing low confirmation here thru mid Feb aka 1160 IMO.
Bull flag forming now intraday.
Same thoughts here, but targeting mid January for the timeframe. ABX likely to go near 10 for the reverse head and shoulders pending confirmation next week.
Knee jerk reaction by gold overnight to the Islamo-Fascist true-to-form terrorism in Paris: Up +$11 at the moment o ftis post.
Woww, so many “technical analysts” here now :o)
let SPX drop , bby
It’s just France, no one really cares.
129 dead aren’t gonna drop the markets too far or too long.
Here we go!http://www.kitco.com/charts/livegold.html
Futures have rebounded and is now above the Friday closing post Paris attack. Ie, the attack is a non event. Which is why gold did not gap up big.
Market is in a downtrendimg cycle.
Echo that with crude.
Gold is holding her own where 1095.80 is key.
With or without tragedy, the show must go on as expected.
I doubt this is a non event. It was a coordinated attack and there may be more. If there are it will seriously damage the European economy. But then again governments have been trying to control the business cycle for decades. Now they are in the business of trying to control stock markets as well.
This is why it’s too dangerous to short stocks.
These charts are all messed up.
This is how I feel: https://www.youtube.com/watch?v=pxcUZQUInRw
France under siege, Japan in recession, futures green. What a desperate attempt by the PPT. Trap door flies open soon.
Gary, I just noticed there is a difference in the different futures chart feeds. When using my Ameritrade and NetDania accounts, they both show gold made a lower low. Stockcharts does not. I’ve posted them here.
http://postimg.org/gallery/k8y75m9m/d23aa046/
I also went to the CME website and it shows a lower low was made. http://www.cmegroup.com/trading/metals/precious/gold.html
Maybe France attack does have an event consequence. That is FED gonna use it as an excuse. No rate hike. Market is a forecaster. She smells it, and hence this rally.
You people are funny. We are already way in the “bubble” move. Where is the move higher going to come from? Corporations have already been leveraged to the gills to buy back stock. Go ahead and bet on hyperinflation, but you are going to be very sorry you did.
Hmmm…. Very funny too. Last I check, gold is in such great downtrend. And Paris attack can’t even keep its $10 gains holding. Like I said , if it’s suppose to go up and can’t go up, its likely going down. Maybe today is the day gold dies again. When it breaks $1000 and goes to say $950, it ain’t gonna be pretty.
Back to stocks, even French CAC isn’t dropping much on this attack. It even cleared Friday’s high. I don’t predict. I interpreted price actions. And price action says stocks good, gold no good.
Based on chart, I would long gold for a trade becos it took out last week narrow range high at 1095. But based on event, I would not. Becos Its so funny, it should rally bigger on tis paris attack, but did not. I recalled one John Travolta movie where he was a terrorist. He bought gold knowing gold would rally. And gold indeed rallied big.
Today’s price action is pathetic. If it closes this weak, I wouldn’t dare touch it.
Paris attack perpetrators must have short index, long gold. Authorities have figured out, the best way to attack them is Long index , short gold. Squeezed them dry. Make them broke. Lol.
as I said yesterday I would do, I closed today at the opening and pre-opening all my positions of the 80% stocks exposure expect for a medical software stock where I have 17% exposure. Thus, back 83% cash.
I marked losses on all closed positions but they were good losses, the largest was -8.5% on NTES due to slippage today (2.2% equity bleed) and the lowest -1.3% (0.13% equity bleed), weighted average loss per closed trade = -4.9%
DCL in stocks may have been already placed today. DCH is in sight but it’s not worth hunting it with an exposure larger than the 17% I now have due to the character of the market –> intermediate cycle decline most likely already in place.
You bears keep trying to make a mirage happen, but much better to see reality for once. Watch the sky. The spx will soon meet your gaze.
Ted, the same story of a bubblish stock market was on the table also on OCT23 when I had called an exhaustion gap-up and that SPX at 2077 was sheer madness 🙂
I got mocked at for having called the EXHAUSTION GAP and the 2077 SPX-notch as unrealistic while reality is the another one, it lies in the middle: stocks have neither been in bubble nor will they produce a new low below the AUG24 level of some 1860.
What I am mad about at me is that I could not foresee that this daily cycle decline would not only be a mere daily cycle decline but the beginning of a larger intermediary cycle correction.
….actually this IC decline is about the market grinding and discounting a strong US labor market and the incoming FED rate hike in Dec –> yes, they will raise rates simply because they need to save face, to show that they are guardians of USD value and that their QE efforts have been objective and transparent, instead of bearing the covert desire of debasing the dollar as a currency.
FED needs to implement the rate hike to rejuvenate credibility. it has become so acute that it is more an issue of politics rather than of macroeconomy.
therefore I expect an ICL on or around the January jobs report –> a strong empl.sit. will be no new news anymore, but rather reason for the market to start going up into its new IC
It was a guessed when exhaustion gap was said, and you should be rightly laughed at. The right way to trade is to sell when SPX 5dma turned down. And you would have sold at quite a high price too.
Prediction is foolish. Recalled your abandoned baby call? No point selling when 5dma was pointing up. If you have ride it, instead of predicting it, you made a lot more.
5dma on broad indexes makes a good observation –> I will study it and see how to incorporate it into my trading. Thank you for this tip, Chris!
On GUESSING:
1) literally everyone here, even you, make references about our expectations. I like being in minority but iterating assumptions about the future puts me in the same majority where you too, Gary and others lie.
2) calling the OCT23 gap to have be exhaustion (abandoned baby candle pattern or another) as well as calling being long on stocks with SPX at 2077 on that date as sheer madness were based on statistics.
Even 5dma lags price action and one may expose to the risk of sudden fall of a too high a cliff –> statistically, it was good luck that the market continued further upwards to 2116 from 2077.
AND RECENT PRICE ACTION HAS CORROBORATED THAT STATISTIC AS ACCURATE ! 😉
Oil plunging, dollar rallying, QQQ underperforming. Still holding SPY short, but if they rig it today for a bullish engulfing candle by EOD I will dump it.
quite a risky trade going short on stocks as it is being long…we may already be in a new daily cycle searching for its high
The authorities are not interested in ‘keeping the stock-market up’. No problem for them with an orderly 20-30% dip, it is their important bond market which they are interested in keeping up and popular, in the process dropping the yields. And during the last days selloff, TLT (bonds) has been going up/yields down. They are satisfied.
For the gold and silver bulls here, you all should note that the 2 are highly correlated to copper. Go look at copper. Maybe look at its monthly. Seems like more to drop. Maybe that explains the tepid action of gold silver. 2 likely scenario in copper. Slow drop for few months, or quick bloodbath phase.
Hi Chris
I think 1035 ish needs to be tested OR its up fora bear rally from here..
Getting ready for the long awaited journey lift off: http://stockcharts.com/freecharts/gallery.html?s=Gdxj
Target 21.26 (minimum).
Consolidation is accumulation and with higher lows and higher highs who needs gold 1194.80?
Crude to 37.75
ANGI consolidation then to new 52 week highs (wanted to buy. 2nd tranche at open but fell asleep?)
FB confirms US Indices will go lower by breaking her gap up down: http://stockcharts.com/freecharts/gallery.html?s=Fb
Gary — aren’t stocks oversold and due for a DCL, a swing low, and resumption of daily uptrend? Adding to longs?
Will agree that the miners are levitating in the face of the metals going virtually no where. CPI tomorrow should clarify things for one group or the other.
Gold making a rather putrid looking candle today.
As expected, stocks are in rally mode!
I called it. And yet, I can’t understand why Gary got so bearish over the weekend. Better to stick to your first instinct.
US Indices turn up by the PPT?
May have to fricken change stance on crude now!
That’s what I mean you gotta watch this market like a hawk every second because it can change on a dime therefore you need to alter stances:
Long crude
Long miners
Long ANGI
US Indices now turning up (aid all three).
PPT’s lesson for the new paradigm against terrorism.
Taking profits in miners from Friday to pick a better spot besides US Dollar strong and gold lower than Friday at the moment.
Adding 2nd tranche in crude long.
Fill the gap phenomenon then trend lower?http://stockcharts.com/freecharts/gallery.html?s=Gdxj
Gold 1094.80 was the sign.
Crude/energy mirroring the US markets (bullish).
Holding ANGI for all the reasons.
Undercut low phenomenon aka inverse candlestick wick seen in all the megatron stocksnlike AMZN: http://stockcharts.com/freecharts/gallery.html?s=Amzn
Selling ANGI for a quick profit (will be back in a few sessions via strategic limit FIB).
Using ANGI proceeds back into FB.