Strictly Necessary Cookie should be enabled at all times so that we can save your preferences for cookie settings.
If you disable this cookie, we will not be able to save your preferences. This means that every time you visit this website you will need to enable or disable cookies again.
For what it’s worth many of the economic numbers in Europe have been improving and many are better than the numbers in the US. This notion that Europe is an economic mess is clearly backwards as the economy is already starting to improve.
QE & 0 interest rates clearly work. The problem is they create bubbles.
Gary, we are fundamentally on the same page.
Two amendments I would have though:
– while I hope stocks to bounce so that I can put a safe, reward-risk-wise short trade, I do not think they will move extensively UNLESS propped by a sub-200k number on today’s jobs report;
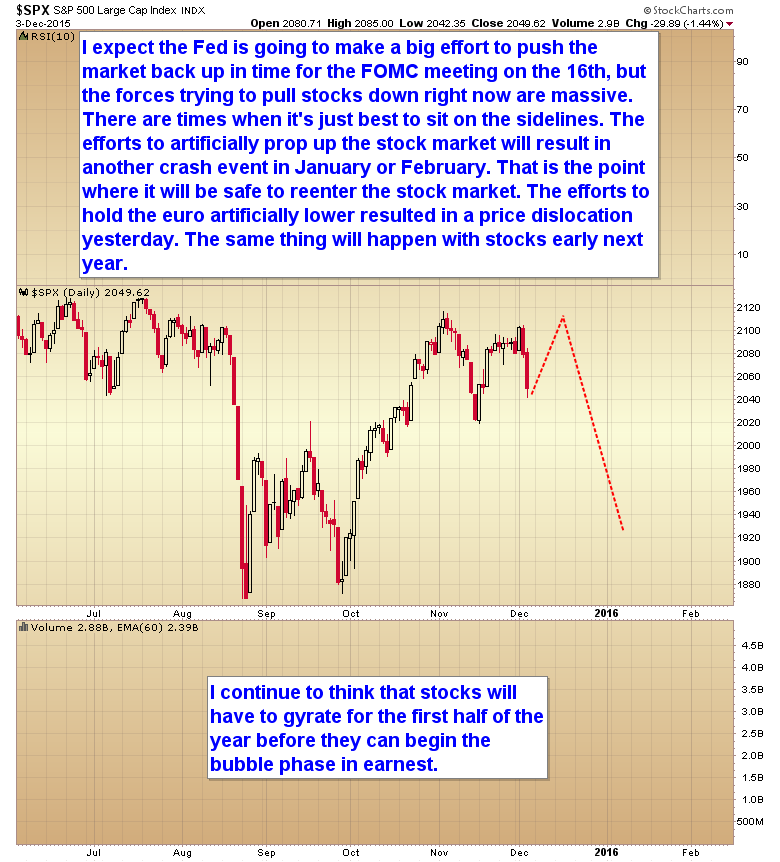
– NO BUBBLE, stocks will grow indeed into the summer/autumn of 2017 but that growth will not have a bubblish character, not yet.
The bubble in stocks will emerge only in late 2018 or so, i.e. after the next bear market when monetary policy will be relaxed and the new Kondratieff Spring will have gained strength –> years 2019-2023 should resemble the 50ies, the years that made history out of Nicolas Darvas and ushered William O’Neil into stock trading legend.
The Fed’s MELT-UP was in progress today. Bears are so fried.
Alex,
Well, I was thinking the same thing. Then, I figured I would call my preconceived thinking a hypothesis, and do what scientists do: Test their hypothesis… only…
… let’s just say that rhetorical question, along with my comment that something was missing from Gary’s 200 period weekly chart, are my gift to you 🙂
But then I gotta thank you mate. A line from The Alchemist sounded in my mind’s ear today:
“When you possess great treasures within you, and try to tell others of them, seldom are you believed.”
Thank you, Z! 🙂 you very kind! A leitmotiv of the ancient Greeks’ Casandric curse 🙂
From the Alchemist I remember only the message of never giving up on the hardship of pursuing something you feel you’re made for, that many give in just when they have one more inch to go to their target.
It is interesting that you hark back to the Alchemist because this thought I had read from it has been a driver for me as a trader despite the several casualties I have incurred.
PS: if for some reason, sometime in the future I’ll grow fond of day trading or I’ll get intent on studying this approach, I’ll remember your gift on the 30-min sample to study
a and z, it is clear you are the same person
what is the point in talking to yourself,
it doesn’t help predictions come true.
came here to get away from yahoo board nonsense.
To refresh your memory, Santiago (the boy) and The Alchemist were crossing the desert when they were stopped by two tribesmen from the wars. The tribesmen searched them, and asked the Alchemist what those strange things he had were, to which he replied that they were the elixir of life, from which one drink would free a person from illness and bring about eternal life, and the philosopher’s stone, which would turn any metal into gold. The tribesmen laughed at the reply. And the Alchemist laughed, too.
200 30-minute candlesticks = about 4 days and therefore complements the daily chart viewed with smaller sample sizes. But of course, that works best if you’re clearly quantifying the departure from the mean. Therefore, it helps identify pivot points on the daily cycle.
The funniest thing was, when I started looking at the 200 sample period over the weekend, with departures from the mean clearly shown, a term popped into my head as I was viewing certain pivot points — Nov, 2014; Jul, 2015 — I had never heard the term used before, so I looked for it on google. It appeared in statistical context, but nothing to do with financial markets. The most common reference was to Sociological stats in Romania. How ironic!
Keep your ears peeled on the OPEC meeting
Bullish action on overseas trading
If oil can resist follow thorugh to the downside after OPEC fails to cut production that would be a clue that it’s probably done going down.
CORRECTION: For a security that trades 6.5 hours per day, 200 periods of a 30 minute chart yield a sample size of 15.4 trading days, similar to sample sizes people use for trading the DAILY cycles.
I use an 8 day sample size on my daily chart, so my 200 period 30 min chart is almost double the sample size of the daily. Both show the same pivot points, but they exhibit different behavior patterns and characteristics, which is why I feel they’re complementary. The most important reasons are:
1. Determining if a particular move is an impulse or a correction, which helps keep me out of nasty low probability trades and traps; and
2. A solid momentum indicator that makes inherent sense to me.
If you believe in the fractal nature of market patterns, this should make intuitive sense: You can break down one degree of pattern into one and/or two smaller degrees, and using a larger sample size at that smaller degree will give you useful information about price action a the higher degree.
copy-paste for later study, Z. Thank you!
indeed: from A to Z and Z to A , nice 🙂
You’re welcome Alex!
And thanks again — you have inspired me break some of my own crappy habits that were counter-productive!
😀 🙂
NFP confirms that rate hike is a done deal; commodities look to bottom while USD looks to correct decisively thereafter…have fun!
It’s not a done deal unless the Fed can get the stock market going back up. They won’t cut into a falling market for risk of accelerating the sell off.
Make sense.
Bought RIO today. 6.5% divy and wayyy oversold.
Merry Christmas Gary
Marvelous bounce in stocks – exactly what I told yesterday to Victor I was looking for.
Covered my short treasuries and just initiated my stock shorts.
I expect treasuries to go up into FOMC and re-short there
Another bad trade (out of long crude) OPEC non event
Shorted crude here
Long miners here
Wish me luck
It’s getting to be ridiculously easy to anticipate these market interventions. We made some pretty good money last year by using this strategy.
into nugt at 25.31 looking ok so far
Gold/Silver/Platinum are forming weekly key reversals and generating weekly MACD Histogram buy signals. There were many contracts changing hands when the yearly lows were breached, assumedly transferring from the unsophisticated to the predatory. Those contracts should be resold to the public at higher levels over the next few weeks, and then the bear can reemerge from hibernation.
excellent bearish data for stocks: besides many, SPX is growing on utilities and consumer staples while discretionaries and transports underperform substantially.
Year 2019-2023, ultra significant years for gold. SPX didn’t break 2130ish this time either. Maybe next time, 20th time lucky?
Tis an insane market. Relentless buying of NDX. Be careful with shorting index. Ndx cup and handle in play. Once new high, it’s confirmation. If you wanna short gotta be nimble
And I understand many would think that one FED raise rates, market at least going to have a knee jerk reaction and drop a while. Before resuming rally. That is based on previous rate high cycle. But imagine FED hike once, then says hiking is going to be extremely gradual, depending on data…. Wow, market may rally big off the annoucements you know.