Strictly Necessary Cookie should be enabled at all times so that we can save your preferences for cookie settings.
If you disable this cookie, we will not be able to save your preferences. This means that every time you visit this website you will need to enable or disable cookies again.
100% agree !
I’m gonna short the semis next week. SOXF
The dollar has caught a lot by surprise. I feel it still has a long way to go and will cause carnage in commodities. Here is a link, for the dollar chart, click on monthly time frame pay attention to MACD, RSI, and stochastic. Compare with the dollar at the end of the 1990’s to early 2000’s, its ominously similar. On the MACD look how the dollar is about to cross, which will signal a buy confirmation. In my opinion we are at the beginning of a dollar surge to 120. Also signalled on the weekly(compare with 2014 rally). Not guaranteed nothing ever is, just worth considering.
http://www.investing.com/quotes/us-dollar-index-streaming-chart
Thanks Dday!
Good! EURUSD and GBPUSD align, USX reverting a bit, taking its breath for the last leg down of the THRUST to bring GBPUSD <1.2378.
Alex my friend…its all there for everyone to see with all the passion and excitement. But as you so elegantly point out, Lady market has a psychiatric condition known as bipolar disorder. The mania is reverting to depression haha. You are spot on in your assessment but because this is a living breathing organism with moving parts some of your calculations needed to be tweaked on the fly.
All the best to you and family.
Alexandru the other day you said you thought gold would be 1300 in one month. Were you joking and if not what could possibly drive gold to 1300 in one month? I just do not see any catalyst.
Brian, pls revert to one of my answers to you yesterday.
I am sorry but I have to direct you to do so because you seem to omit passages from read statements since this is the 3rd time in 24 hours that you ask me about things I’ve replied to you or otherwise stated, such as asking me if I had changed my view on a stock market pullback right after I had said I would replace SPXU with FAZ and buy ERY later or when I see gold back to 1300 even though I had replied you “next month” and now the third…
Pls consider my replies yesterday.
Regards!
Yes Alexandru, you replied you think gold 1300 next month so my question is what would be the catalyst? So why not just answer my question as to why you see gold to 1300 “next month”?
Pls check better, you also have the answer to why.
No offense but you are wrong on much of what you predict so I will use you as a great contrarian indicator. Good luck with your pie in the sky 1300 in one month.
Thank you!
Good luck to you too!
Alex did put his reasoning in the previous thread. Though in Brian’s defense i will say this blog format makes it difficult to keep track of replies as compared to a traditional forum.
I happen to agree gold will hit 1300 within one months time. Before the FOMC on December 13th and 14th and then a rate hike, if one comes, will send it back down again. So that gives us about 20 trading days to work with any gold bounce that comes before we might want to take chips off the table. On a positive note the Yen looks like it may end its declines today. So that’s bullish gold trades for next week.
DAVE ROBSON, now we have the much awaited undercut in GBPUSD, on day 18 of its daily cycle 🙂
As I’ve stated before, now I am lurking for the gold bull with 2 cumulated signals to enter with half of a full 25% equity position on UGLD and then with the remaining half [at a higher price] on follow-through on subsequent day, namely:
– swing low in GBPUSD and
– swing low in whichever first: gold or miners.
now everything looks quiet as if foretelling incoming volatility through US trading hours: the last leg of the THRUST.
Waiting for those signals, good luck, Dave!
Patiently waiting …… thank you Alex
EURUSD is in a left-translated yearly cycle with the prior YCL at 1.0538 one year ago.
Therefore, we should now expect an undercut of that low to confirm the multi-year Bear of the pair.
Now that GBPUSD nail has been cleared, my eyes are on that EURUSD 1.0538 undercut –> quite likely on the ensuing high volatility today or on Monday.
BEKIND, yes you are right!
And it is with regret that I’ve missed an extremely important element from my analysis (THE MAIN POINT), the one I just mentioned: I SHOULD HAVE NOTICED EARLIER, I SHOULD HAVE LOOKED AT THE YEARLY CYCLE STRUCTURE OF EURUSD PAIR AND THEN I WOULD HAVE SEEN THAT LEFT-TRANSLATION AND THAT WE NEED THAT DAMN 1.0538 UNDERCUT before all this depression is over.
I’ve missed it! :(:( I don’t know how but I am so angry now!
PEDESTRIAN, we have to see, it is tranquility before the storm – depressions have phases and are deep.
Once the THRUST came yesterday post ECB minutes (after USX had returned to 99.9 area) and USX cleared to higher ground, above 100.72, this mania should prove deeper – this is as a matter of principle.
Now that I see [too fxxxing late!] that 1.0538 YCL in a left-translated YC, we get a clearer picture as to what depths the market should succumb first.
We have a saying…Close enough for government work haha.
All, Please be certain your seatbelts are securely fastened and keep your hands inside the ride at all times.
Alexandru, the markets (s+p, Nasdaq, DOW) are correcting like you said they would- but to the upside! You missed the market signals too.
Alex do u still see sub 1182 by Monday. I think the price action in gold looks more like consolidation with surprise likely to be to the upside. I think a lot of traders are going to miss the train
Not all left translated cycles make a lower low. The left translated 8 year cycle in gold did not. And the most recent left translated intermediate cycle in the stock market didn’t.
It’s a pretty dependable rule but not 100%.
terrywg nobody is going to miss the gold train
Brian why not share what your target entries are then.. very easy to criticise others (Alex for example) and make generalisations )
Terry, with EURUSD producing a lower YCL below 1.0538 on mania … I don’t know where gold will get…
Let’s just wait and see. I’ll get back in once that lower YCL is set and the two above-mentioned swings occur.
PS: Now gold gaining some strength is bearish !!!! It tests its former support at 1211 before diving as EURUSD approaches its former YCL.
Alex, be open to possibility you don’t get yout EURUSD undercut low.
anything is possible, it’s just weighing probabilities but it is more likely that it will, far more likely…on Monday/Tuesday.
Gold is now weaving its former support 1211 into resistance…
If only I had seen taken a look at EURUSD’s weekly chart earlier …. 🙁
terrywg do the opposite of those who come across very sure of themselves.
I suspect the bond market still holds the key. If it trickles down slowly no problem.
If we get another week where the 30 year price drops 5% then we have big problems. The bond bull won’t just be topping it will be crashing.
Gary how is it you got gold so wrong?
that’s irrelevant, Brian.
every trader has his/her own cycles of ups and downs.
the important thing is risk management – this is what saves us long term.
I remind you Richard Baruch’s words I also told you yesterday that one can raise a fortune by being right 3 out of 10 times as long as he keeps losses small on the other 7.
Thus, telling a trader “you’ve were wrong” is irrelevant outside of his trading spectrum as long as he took a small loss only.
REALLY WRONG IS ALLOWING YOUR LOSSES ESCALATE ON ANY GIVEN TRADE! THAT IS WRONG.
I simply got caught by a cycle that topped on day two. I was just looking for a 2-4 day trade. I was expecting an ICL but thought I could catch a short term trade before it started in earnest.
Then we got the overnight crash so there was no opportunity to get out. I did warn traders to consider a stop at 1275 if gold dropped below that level. Anyone who used the stop should now be waiting for the next swing and confirmation that the ICL is complete.
Nobody gets it right all the time. Gary was following his model that works for him. Sometimes, price movement does something totally unexpected and one could get caught on the wrong side. Appropriate action at that point would be to bite the bullet and exit the trade pronto. Just an opinion.
I’m sorry but I’ve got to say something here. Gary if you trade topped after day 2 that should have been your signal to get out as the trade was not working out. I brought this up to you and suggested stopping out and was told to not worry about it as it was a wiggle. You suggested the 1275 stop about a month later only after you closed the model portfolio and all the people you led into that trade were sitting a +50% loss , so don’t make it sound like you were being proactive because everyone was way offside by time you suggested this. Gezzzz
For people looking at Gold…..I again remind you as I have done several other times…it is the most expensive market in Commodities.
Gold buys more of SIlver, Platinum, Oil , Corn, Natural Gas…then almost any other time in history.
That mean reversion trade is what you need to focus on.
Or if you don’t want to do long short…just go long Energy. Over the next 2 years the chances of you doubling your money are almost 90%. The chances of you outperforming Gold stocks, which are the WORST companies for diluting and eroding shareholder value…is 100%.
You are right Duck. I happen to agree. And it could get a lot worse for gold even as oil, grains and gas start to eventually move up in serious way from very deep lows. Certainly from a ratio perspective. There are just better bets coming and they are not that hard to see as they approach over the horizon.
And all the more so if gold does what the longest term charts imply which is to fall lower yet. Even now I am only interested in playing it for a quickie. Forget the chapel and long term vows. Gold was a winter fling at best. That gal doesn’t get no damn tattoo on my arm. The most I will commit to is a T-shirt that says I’m with her. Anyway, I have the hots for your younger sister Platinum.
That gal’s got legs!
I bet no rate hike in Dec
And a nice profit on my GC Friday day trade!
The fat lady is clearing her throat but just not ready to sing.
I will pass on the long side for now.
It would seem that the dollar hasn’t conformed very well to Gary’s cycle theories.
The dollar certainly fooled me. I didn’t anticipate the extremely stretched cycle.
Markets can do anything any day. This is common knowledge. All that a player can do is to develop a model that works some of the time. All models, techniques fail at times. Folks have tried all kinds of methods: neural networks, expert systems, fuzzy logic, etc. They work for some time and then stop working. One needs to constantly update his models and never use any single indicator as a stand alone indicator. Look for plurality instead of one/two events. That is all we can do.
I see everyone here trading NUGT, JNUG and DUST….and I hope you all have your stops tight.
Quiz
If at the start of every year since 1960…..if you knew exactly where every stock index would be at the end of the year…..how much leverage would you take?
just as I do now: ponder my trades risk-management-wise –> no trade with too high a volatility + no risk more than 1.25% of my equity per trade + only averaging up trades.
The correct answer to above…is that even if you knew exactly where the Index would end up …with perfect advanced knowledge…..you would get wiped out (greater than 90% loss) multiple times if you used anything over 2.5X leverage.
So even with perfect knowledge of the final price but knowing the path that gets you there you would lose everything. So why the frack would you “invest” in those vehicles when you DON’T KNOW what is going to happen?
EURUSD @ 1.0614 but…
Depression is too deep: to end once EURUSD in 1.04 territory.
Bye bye guys!
Be careful with those long-gold trades!
PS: My other expectations, Trading Framework through JAN are unaltered, just that we have to wait through Monday/Tuesday for THE SCORCH TO START (stocks+other commodities down, gold+treasuries up)
Alexandru it is always a warning when someone talks with such conviction- ” wait through Monday/Tuesday for THE SCORCH TO START (stocks+other commodities down, gold+treasuries up)”
Market (DOW, S+P, NASDAQ) may continue higher despite your conviction otherwise… You have no idea when or if the market will correct.
t’s all about the dollar. showing no sign of coming back therefore more of the same. rather than wishing for it to happen Alex, best to see it materialize before stepping in. If dollar does reverse, there will be plenty of time to take your trade ideas into play. The trend and momentum is set, and can go on longer than anybody can expect. Most often the end of such trend, either up or down, in this case the dollar, has it’s most violent move at the ending point of the move.
quickly back in to my desktop just to check my expectation of EURUSD back under 1.06 in less than 20 minutes 🙂
it looks it’s working on it right now 🙂 🙂
JONSYL, you know the funny part ??? That I would have been a gold bear until EURUSD at 1.04 ONLY HAD I LOOKED AT THE EURUSD WEEKLY CHART BEFORE 🙂
Everybody here following my tweets know that I was looking for gold to 1182 but USX at 99.90 pivot made me become a bull on Monday.
Had I only looked at that chart …… 🙁 my omission my mistake
So EURUSD to 1.04 !!!
I am leaving – nothing interesting worth seeing now – the dice have been cast
Hay Alex are you using twitter for tweets ?
impeccable logic
Guys, Hui is a very technical instrument. $hui HS target is 140 to 120. Yes, a trendline support could be drawn showing support has been met. But HS is more respectable, ie , more confidence of it materializing for Hui. So, it shouldnt bode well for gold too.
Gold this week has to close above 1208 ish. Else, danger.
I’m not sure why anyone thinks the metals are forming a H&S. Those occur at the top of bull markets, not at the bottom. I heard the same nonsense about the mining chart last January. It was obviously wrong then and I’ll wager it is wrong now. We clearly aren’t at the top of a bull market.
Understand Alex, but having discovered that oversight, no point repeating it. Still feel you’re looking at wrong thing. Focus at US dollar. If it doesn’t change course with conviction nothing else matters.
Eventually this dollar rise will have a very negative effect on sectors other than commodity prices. US needs to be competitive, it’s pricing itself out of export markets. Trump can’t afford to shut down US trade thru shutting down trade deals and also pricing his goods out of reach for his own country and internationally. The rise of interest rates together with dollar will make that a nightmare.
And yes, there is a smartAlec here that highlighted gold is expensive to oil copper etc. I guess its Duck right. Good point. So, dont be obsess with gold. We can look at other things.
So happy I got out of everything PMs once the dollar got above 100.
It seemed obvious. A thing that touches a resistance 3 times, will break it to the upside on the fourth in most of the cases.
Maybe a good time to get in again?
put up a chart of dxy, on multiple timeframes and try and find any weakness in this move. Why would anyone buck this trend except with wishful thinking. Most here are gold bugs and gamblers not investors. but especially if you’re one of these, its important to know the context in which you gamble. All bets are risky, but not having any regard to the house rules makes you a loser before you place your first bet. This blind following of cycles is buck. It’s like claiming that flipping a coin gives you fifty fifty odds. Problem is, you have no idea how many flips it takes to achieve that statistic. More often than not, you go broke trying.
Sorry for the lecture.
You can never spot turning points by looking at charts. This is why technicians never catch these turns. At tops price will look like it’s going up. At bottoms price will look like it’s going down.
To spot major intermediate turns you need different tools. Sentiment, COT and cycles. Sentiment is extreme in the dollar. I suspect the COT will also be nearing extremes for the dollar this week. And gold is in the timing band for a daily cycle low. Given how late it is in the intermediate cycle the daily cycle low should also be an intermediate cycle low.
Good thinking.
There could be still some upside in ndx long etfs for nimble traders. My be not in soxl. Time will tell.
posted yesterday of expectation that market would have pullback today into monday. If pullback impulsive with conviction, would be first sign of any reversal. So far not much more than what was seen all week, pullback into midday then continuation. Also dollar needs to accompany the equity pullback which is still not evident. Best to continue watching before making any bet on downside in equities and upside in gold as Alex projects.
Only 90 dollars more until platinum hits its January starting point.
It will bottom in the same place it began.
It has already lost 285 dollars since it topped in the summer (more or less) around the same time as gold and silver. This is the kind of chart that really bothers me because it talks about the fundamentals of the economy, deflation winds and precious metals demand all at the same time. When I have any lingering doubts about gold they are always negatively confirmed by the platinum chart which is heading back to where it began in January just as surely as night follows day.
Maybe Alexandru is right to say this is a bi-polar commodity. I feel that way too. I am entirely of two minds wanting to buy on the one hand because of sentiments and price but go short on the other because it looks like the metals charts are pure death on wheels.
Now that I think about it maybe this is a split personality thing.
What to do? What to do?
Probably nothing today. I need a good, solid sign to break the indecision. Something more encouraging than today’s 30 dollar platinum plunge. Hey, maybe this metal really is telling us something important.
And maybe we should be listening.
U guys have to understand, PMs are for storage. They have little economic uses. They give no interests. So , when banks are shaky, when rates are low, they do well. Now, market knows banks are doing well. Rates going higher. So which idiot wanna hold PMs?
Conversely, industrial metals are different. You need them to produce goods. Hence this bipolar market
Then explain to me how gold rallied from 2001 to 2007 during a period of time when the banks and economy was booming?
After that explain to me how gold rallied from 2009 to 2011 as the economy and banking system was recovering from the financial crisis?
The fact is that for most of the last 16 years gold, oil and the CRB have rallied right along with stocks.
Rates were low then. Now rates are rising.
Also, USD was weak then. Now USD strong. Good banks, good dollar, good rates, who wants gold?
Bottom line, why be obsessed with gold when we face headwinds. Seems like easier safer money is in industrial metals?
Chris… I believe its the opposite
Go look at palladium. It’s doing fine. So gold and platinum is really a waste of time
gdxj is not confirming lower low in gold. Preparing for a bounce? Today is OE day. May be next week? Time will tell. Nothing goes straight down. gdxj to make a bounce before heading further south? Who knows? I don’t. We need to wait on price.
gold @ 1206.55 –> short position
gold has the wall of resistance at 1211 very close, it should break soon sub-1200 with a lot of reward-risk potential. A CASCADE FAAL IS ON HIGH PROBABILITY TO ENSUE!!!
Dont fight the trend, be his friend!
just tweeted; cannot stay.
bye! good luck!
Correct me if I am mistaken. I thought you stated yesterday you were expecting gold to rise with stocks and dollar dropping next week?
I meant, next week stocks and dollar dropping.. and gold rising..
USD Index, no real resitance till 102.5, 104.5, then if it breaks 106 up to 120. Take a look at my reasoning at the top of the comments.
stop loss for my short @ 1215 –> 8.5 bucks at risk
cheers
Alex, another guess?????????? Like playing the slots??? Maybe yes and maybe no.
what happened to all the heavy duty insights and conviction on these.
hi, I read often but don’t get to post much.
Firstly, thanks to Gary for allowing this open forum. There are many, many people out there that would not allow this and don’t allow it. So thanks, even if you have to take it on the chin sometimes.
Here is my update:
I shorted the rally up to the summer. Did not double down on the shorts at the top, so came out even when final tally of DUST and long miners was taken into consideration. PS you can keep Dust/Nugt for months and months and still come out on top. I never worry about the decay over a period of months as long as I get the general direction right. I thought the drop in PMs would be in the summer but is now in the autumn. – no doubt election had something to do with that.
I shorted the SM rally and put hedges on . I unwound these and came out even.
If I had followed Gary’s signals give on this FREE website I would have been UP with far less stress. But I have my own way of trading and it suits me, as I can not be at a screen all day.
Personally I don’t like Gary’s statements when he says “I guarantee…” but then when I hear this I just translate this to ” There is a high probability in my opinion…” . But that is a small price to pay for his insights.
Back to the present state of my trading account (say 30% of total account):
100% allocated into NUGT
100% allocated into JUNG
100% allocated into HGU
100% allocated into Gold and Silver
50% allocated into SQQQ and the rest (got stopped out of some)
100% allocated into FAZ
Would like to go long oil when I get a chance.
Yes I use stops but not mechanical and will reset the PM at a lower price if need be.
(other 70% of account long term long stocks )
Well that’s where I am.
I would like to be able to pick the exact spot for buying and selling like some of you guys but I just try and get in / out within 15% of any bottom or top.
Enjoy reading all your comments and I hope to get as good as you guys at identifying exact points for buying / selling but until then I need to surf my own way.
Thanks again Gary for the platform for free speech and taking the rougher comments on the chin.
PS can anyone tell me what “PO” means? as it is always quoted or on charts, I am assuming it is the target price.
Yes, Gary deserves credit for allowing our first amemdment rights on this site, particularly where they are often targated at him. Guys like Alex and Gary, provoke debate and sharing of ideas which is a good thing. We just have to remember that constructive criticism is a good thing, verbal abuse isn’t
Hi all, long time reader first time poster. Dday I wss just playing with charts comparing USD to euro, Swiss franc and jpy. The euro is showing an uptrend against jpy and both the franc and euro are showing resistance against usd. In my opinion the European economy and the US economy are not what they were before September 11 were the USD posted 120. I can’t predict how high USD will go but even on par with the euro seems unlikely let alone 120. The thing is all of this is speculation on a trump win and a likely rate hike in December. There is zero economic data to support a rise in USD at this rate. JPY, euro, gbp and the franc would have to crumble for a usd @ 120 and the economic indicators for such a collapse are absent for me. Anybody please feel free to challenge this hypothesis.
Gary,
Looking at Gold RSI is still rather low, although there may be a small divergence, but end of 2015 it looked far stronger. Is it possible we need a final low with higher RSI?
Furthermore what about US$ and gold going up at the same time as in 2002 when gold was anticipating the US$ top later on.
http://www.gold-eagle.com/article/can-gold-price-continue-rise-us-moves-higher-too
Hi all, I am looking at other miners like ABX and GG. There were heavy put buyers this morning and price has stabilized. On GDX i saw lots of buying in 20.85 -20.9 range. USD monthly chart has heavy resistance 101.6 – 102. I think the probability of 1180 has lessened so im hopeful now. Alot of EWT technicians are calling a good bounce from here. Also it is very late in gold daily cycle and near enough for YCL according to the Cycle analysts. I am more hopeful now to recover some losses. Looks like GDX can go to 24 range by next month where I will sell regardless if its a loss and then we get a shallow dip before heading to 25+. GL to you all I nearly closed my account but I am remaining hopeful.
Hi, Robert. No expertise in EWT, but my read is likewise. Time will tell. Bounce first. Folks will have a chance to lighten up during the bounce. Cheers.
That’s the spirit Robert. Quitters never win.
Even if we get to 1180 I think miners will not fall much lower they have already possibly bottomed. Keeping the faith
aem, the bellwether, is powering up. Cheers.
Cheers
Gold and silver are now forming a bottom due to the swing failure in both metals.
COT report for positions as of November 15th…look much improved.
But still shocking how many retail investors are taking a pounding like this without closing their positions.
We need a few more weeks of shakeout.
You guys who trade crude oil probably already know this but I will mention it for anyone else who might not have heard that UWTI and DWTI are going to be delisted and you have until December 8th to close out your positions. Kind of curious though because those are probably the most popular oil ETN’s available. But that’s the news from Credit Suisse,
From Zerohedge:
“Credit Suisse reported that “as part of its continuing effort to monitor and manage its suite of exchange traded notes, Credit Suisse AG has decided to delist” two of the most popular 3x levered oil ETNs, DWTI and UWTI, “with a view to better aligning its product suite with its broader strategic growth plans.
Accordingly, Credit Suisse AG anticipates that the ETNs will continue to trade on NYSE Arca up to and including December 8, 2016 and that effective December 9, 2016, the ETNs will no longer be listed for trading on any national securities exchange. In addition, Credit Suisse AG will suspend further issuances of these ETNs effective December 9, 2016.”
Wonder what this really means? Me too. Anybody here know?
Double posted?
Stupid computer (pointing at self and laughing as I type).
Haha…It happens a lot…sometimes WordPress will catch it.
Not a chance these high tech software systems are fast enough to keep up with my screw ups.
Not yet anyway. It’s why I keep praying for better supercomputers!
Eventually 🙂
Not too happy about the de-listing of UWTI/DWTI. I liked those products as I felt they were a pretty good alternative to trading crude futures. This reminds me a bit of political interference, not unlike the Pattern Day Trade rule some 15 years ago…this notion that the regulators are there to try and “help” the small investor. IMO, they probably did some study and found a few too many account wiped with the 3x ETF’s, but I’m sure that it’s no different than what happens with futures accounts.
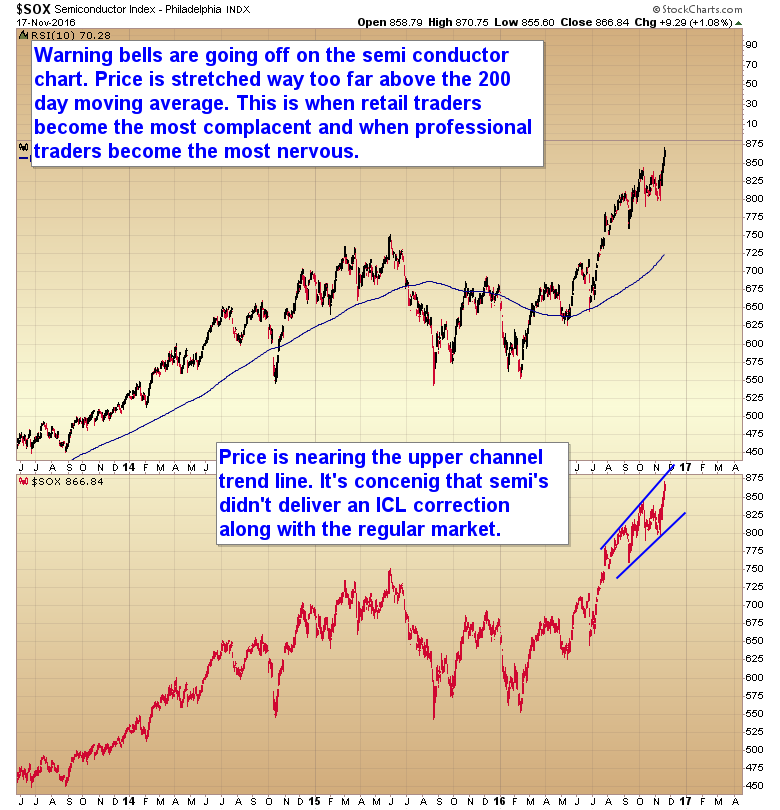
Sure got the semis wrong again today
No no no. This is not a day trade.
When I see something stretched that far above the moving average it means you have to time the exit perfectly or you risk getting caught in a severe sell off.
The same thing happened with miners. One could have noted they were too stretched at 60% above the 200 DMA and then watched as they gained another 10%. But ultimately look what happened. Price regressed back to the mean. The same thing will happen with semi’s. They will top, and catch all the chasers, and their complacency will be rewarded with losses.
Gary, you said HS does not form at bottom. True, but dude what is bottom. Hui goes to 50? So this HS ain’t bottom . My point is, if you look at 52 week chart, a good case of HS could be made. Who says Hui can’t go to 120 or even 100 to form a double bottom.
Gary is not correct on this point. Classical technicals do not mention Head and Shoulder formations at the bottom of a pattern because they are not reliable enough. Not as reliable as top H&S patterns. But they do exist and you can see it for yourself by reviewing any old charts. There really are not that many hard and fast rules in technical analysis. That’s why it’s really more art than science. It is up to the analyst interpreting what they see in reference to other information that allows correct conclusions so I would not disregard a pattern just because the book on technicals does not talk about it. For an example, just look at the H&S on gold that appeared during the second half of 2013. What resulted was a double bottom and a bounce followed by declines for the next two years. At the time that H&S appeared some popular analysts just insisted it was meaningless information coming at the bottom of a long decline. But it was surely tradeable and worth the time. I know, I shorted there and did very well by ignoring the rigid doctrine of the bugs who refused to accept what was in plain sight.
Gotta specialize in momentum trading vs. chasing gold.
Once depression gets so strong as it can be seen now (above my expectations i admit), it never ends in a straight line and then up.
Thus, I think we have a very high probability that EUR will bottom in DEC with a slight undercut, in a very shortened daily cycle (maybe only 12 days long), of the low to be established on Monday/Tuesday.
Technically this is underscored by an already USX on day 10, to become 12 if USX tops on Tuesday Asian trading – hence right translation which implies a higher high in the next daily cycle to top aground FOMC meeting.
Gold I think will bottom early next week blw 1200 but will return close to it on FOMC – growth on volatility, the mark of gold’s trend in the future!
Regards
Also technically, once depressions and manias of optimism go so deep, intermediary and yearly cycles get very left and right translated respectively.
Thus, an ICH for USX on week 17 on FOMC week instead of early next week on week 14, would be worthy of such a mania for USX and profound depression for EUR.
A marginally igher high for USX then will not bring also a higher high for stocks – they have to initiate their fall to YCH (the scorch) early next week as USX tops.
Alex– you meant YCL…. in stocks..?
Good evening Alex. So you think USX will top temporarily next week only to retest it on FOMC (with gold retesting its lows on FOMC after bottoming next week as well?) GBP/USD very clos to your target…. I think with the mindset will probably overshoot it. Lets see what next week brings..
Like a tomb around here this morning. The bugs sure get quiet when their little precious gets squashed. Not sure why either because its probably due for a pretty decent rally after the bloody-knuckle beating it has been taking this past while. Cheer up people. There is always another day.
Like Monday. What could possibly go wrong?
Cot report looks like months of sideways coming
Interesting times for gold.
Keeping positions small.
Any upside within the next month will be limited and a good time to short.
If gold and silver didn’t bottom on Friday, they should on Monday or Tuesday of next week—that’s according to the CMF and HTD principal or the HUP. Be bold. Don’t give up hope, gold is still in a bull market.
Sorry, principle not principal.